SunTrust 2009 Annual Report Download - page 91
Download and view the complete annual report
Please find page 91 of the 2009 SunTrust annual report below. You can navigate through the pages in the report by either clicking on the pages listed below, or by using the keyword search tool below to find specific information within the annual report.
Corporate Other and Treasury
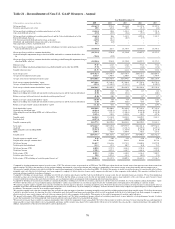
Corporate Other and Treasury’s net income for the twelve months ended December 31, 2008 was $860.5 million, an increase
of $610.0 million from the same period in 2007.
Net interest income increased $313.9 million over the same period in 2007 mainly due to increased gains on interest rate
swaps employed as part of an overall interest rate risk management strategy. Total average assets decreased $4.1 billion, or
17.1%, mainly due to the reduction in the size of the investment portfolio in 2007 as part of our overall balance sheet
management strategy. Total average deposits decreased $7.9 billion, or 35.5%, mainly due to a decrease in brokered and
foreign deposits as we reduced our reliance on wholesale funding sources.
Total noninterest income increased $555.4 million compared to the same period in 2007 mainly due to increased gains on
securities and the sale of non-strategic businesses. Securities gains increased $431.4 million primarily due to the sale of Coke
common stock, partially offset by market value losses related to certain ABS that were estimated to be other-than-
temporarily impaired. Trading gains and losses increased $40.2 million as gains on our long-term debt carried at fair value
were partially offset by losses on certain illiquid assets. Gains on our public debt carried at fair value, net of related hedges in
2008, were $431.7 million as compared to $140.9 million during 2007. The increase was also due to an $86.3 million gain on
our holdings of Visa in connection with its IPO and an $81.8 million gain on sale of TransPlatinum were offset by an $81.8
million decrease in gains on the sale/leaseback of real estate properties.
Total noninterest expense increased $67.7 million from the same period in 2007. The increase in expense was mainly due to
a $183.4 million contribution of Coke common stock to our charitable foundation recognized in marketing and customer
development expense. The increase was offset by a $33.5 million reversal of a portion of the Visa litigation expense.
75


