SunTrust 2009 Annual Report Download - page 100
Download and view the complete annual report
Please find page 100 of the 2009 SunTrust annual report below. You can navigate through the pages in the report by either clicking on the pages listed below, or by using the keyword search tool below to find specific information within the annual report.-
 1
1 -
2
-
3
-
4
-
5
-
6
-
7
-
8
-
9
-
10
-
11
-
12
-
13
-
14
-
15
-
16
-
17
-
18
-
19
-
20
-
21
-
22
-
23
-
24
-
25
-
26
-
27
-
28
-
29
-
30
-
31
-
32
-
33
-
34
-
35
-
36
-
37
-
38
-
39
-
40
-
41
-
42
-
43
-
44
-
45
-
46
-
47
-
48
-
49
-
50
-
51
-
52
-
53
-
54
-
55
-
56
-
57
-
58
-
59
-
60
-
61
-
62
-
63
-
64
-
65
-
66
-
67
-
68
-
69
-
70
-
71
-
72
-
73
-
74
-
75
-
76
-
77
-
78
-
79
-
80
-
81
-
82
-
83
-
84
-
85
-
86
-
87
-
88
-
89
-
 90
90 -
 91
91 -
 92
92 -
 93
93 -
 94
94 -
 95
95 -
 96
96 -
 97
97 -
 98
98 -
 99
99 -
 100
100 -
 101
101 -
 102
102 -
 103
103 -
 104
104 -
 105
105 -
 106
106 -
 107
107 -
 108
108 -
 109
109 -
 110
110 -
111
-
112
-
113
-
114
-
115
-
116
-
117
-
118
-
119
-
120
-
121
-
122
-
123
-
124
-
125
-
126
-
127
-
128
-
129
-
130
-
131
-
132
-
133
-
134
-
135
-
136
-
137
-
138
-
139
-
140
-
141
-
142
-
143
-
144
-
145
-
146
-
147
-
148
-
149
-
150
-
151
-
152
-
153
-
154
-
155
-
156
-
157
-
158
-
159
-
160
-
161
-
162
-
163
-
164
-
165
-
166
-
167
-
168
-
169
-
170
-
171
-
172
-
173
-
174
-
175
-
176
-
177
-
178
-
179
-
180
-
181
-
182
-
183
-
184
-
185
-
186
 |
 |

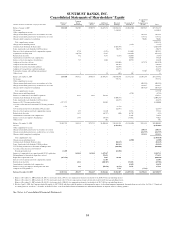
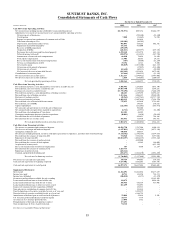
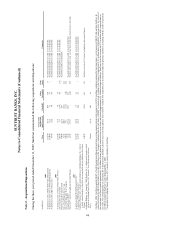
SUNTRUST BANKS, INC.
Consolidated Statements of Shareholders’ Equity
(Dollars and shares in thousands, except per share data)
Preferred
Stock
Common
Shares
Outstanding
Common
Stock
Additional
Paid in Capital
Retained
Earnings
Treasury Stock
and Other1
Accumulated
Other
Comprehensive
Income Total
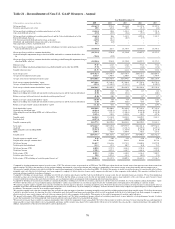
Balance, January 1, 2007 $500,000 354,903 $370,578 $6,627,196 $10,541,152 ($1,032,720) $925,949 $17,932,155
Net income - - - - 1,634,015 - - 1,634,015
Other comprehensive income:
Change in unrealized gains (losses) on securities, net of tax - - - - - - 243,986 243,986
Change in unrealized gains (losses) on derivatives, net of tax - - - - - - 139,732 139,732
Change related to employee benefit plans - - - - - - 70,401 70,401
Total comprehensive income 2,088,134
Change in noncontrolling interest - - - - - (1,125) - (1,125)
Common stock dividends, $2.92 per share - - - - (1,026,594) - - (1,026,594)
Series A preferred stock dividends, $6,055 per share - - - - (30,275) - - (30,275)
Exercise of stock options and stock compensation expense - 2,794 - (1,471) - 211,460 - 209,989
Acquisition of treasury stock - (10,758) - 71,267 - (924,652) - (853,385)
Restricted stock activity - 682 - 8,197 (3,535) (10,507) - (5,845)
Amortization of restricted stock compensation - - - - - 34,820 - 34,820
Issuance of stock for employee benefit plans - 785 - 2,046 - 60,594 - 62,640
Adoption of fair value election - - - - (388,604) - 147,374 (241,230)
Adoption of fair value measurement - - - - (10,943) - - (10,943)
Adoption of uncertain tax position guidance - - - - (41,844) - - (41,844)
Adoption of leveraged lease cash flows guidance - - - - (26,273) - - (26,273)
Pension plan changes and resulting remeasurement - - - - - - 79,707 79,707
Other activity - 5 - 58 (459) 412 - 11
Balance, December 31, 2007 $500,000 348,411 $370,578 $6,707,293 $10,646,640 ($1,661,718) $1,607,149 $18,169,942
Net income - - - - 795,774 - - 795,774
Other comprehensive income:
Change in unrealized gains (losses) on securities, net of tax - - - - - - (806,586) (806,586)
Change in unrealized gains (losses) on derivatives, net of tax - - - - - - 688,487 688,487
Change related to employee benefit plans - - - - - - (507,925) (507,925)
Total comprehensive income 169,750
Change in noncontrolling interest - - - - - (4,728) - (4,728)
Issuance of common stock for GB&T acquisition - 2,221 2,221 152,292 - - - 154,513
Common stock dividends, $2.85 per share - - - - (1,004,146) - - (1,004,146)
Series A preferred stock dividends, $4,451 per share - - - - (22,255) - - (22,255)
Issuance of U.S. Treasury preferred stock 4,717,971 - - 132,029 - - - 4,850,000
Accretion of discount associated with U.S. Treasury preferred
stock 3,732 - - - (3,732) - - -
U.S. Treasury preferred stock dividends, $471 per share - - - - (22,847) - - (22,847)
Exercise of stock options and stock compensation expense - 495 - 16,160 - 39,766 - 55,926
Restricted stock activity - 1,693 - (46,797) (450) 46,712 - (535)
Amortization of restricted stock compensation - - - - - 76,656 - 76,656
Issuance of stock for employee benefit plans - 1,695 - (56,834) - 134,862 - 78,028
Other activity - - - 501 - - - 501
Balance, December 31, 2008 $5,221,703 354,515 $372,799 $6,904,644 $10,388,984 ($1,368,450) $981,125 $22,500,805
Net loss - - - - (1,563,683) - - (1,563,683)
Other comprehensive income:
Change in unrealized gains (losses) on securities, net of taxes - - - - - - 280,336 280,336
Change in unrealized gains (losses) on derivatives, net of taxes - - - - - - (434,795) (434,795)
Change related to employee benefit plans - - - - - - 251,212 251,212
Total comprehensive loss (1,466,930)
Change in noncontrolling interest - - - - - (4,500) - (4,500)
Common stock dividends, $0.22 per share - - - - (82,619) - - (82,619)
Series A preferred stock dividends, $4,056 per share - - - - (14,143) - - (14,143)
U.S. Treasury preferred stock dividends, $5,004 per share - - - - (242,688) - - (242,688)
Accretion of discount associated with U.S.
Treasury preferred stock 23,098 - - - (23,098) - - -
Issuance of common stock in connection with SCAP capital plan - 141,868 141,868 1,687,867 - - - 1,829,735
Extinguishment of forward stock purchase contract - - - 173,653 - - - 173,653
Repurchase of preferred stock (327,489) - - 5,047 94,318 - - (228,124)
Exercise of stock options and stock compensation expense - - - 11,406 - - - 11,406
Restricted stock activity - 1,812 - (206,305) - 176,603 - (29,702)
Amortization of restricted stock compensation - - - - - 66,420 - 66,420
Issuance of stock for employee benefit plans and other - 962 - (55,270) (1,979) 74,791 - 17,542
Adoption of OTTI guidance 2- - - - 7,715 - (7,715) -
Balance, December 31, 2009 $4,917,312 499,157 $514,667 $8,521,042 $8,562,807 ($1,055,136) $1,070,163 $22,530,855
1 Balance at December 31, 2009 includes ($1,104,171) for treasury stock, ($59,161) for compensation element of restricted stock, $108,196 for noncontrolling interest.
Balance at December 31, 2008 includes ($1,367,752) for treasury stock, ($113,394) for compensation element of restricted stock, $112,696 for noncontrolling interest.
Balance at December 31, 2007 includes ($1,688,521) for treasury stock, ($90,622) for compensation element of restricted stock, $117,425 for noncontrolling interest.
2 Effective April 1, 2009, the Company adopted the update to ASC 320-10, which provided the guidance in determining the impact of other-than-temporary impairment. Amounts shown are net-of-tax. See Note 1, “Significant
Accounting Policies” and Note 5, “Securities Available For Sale” to the Consolidated Financial Statements for additional information on adoption of this accounting guidance.
See Notes to Consolidated Financial Statements.
84