SunTrust 2009 Annual Report Download - page 60
Download and view the complete annual report
Please find page 60 of the 2009 SunTrust annual report below. You can navigate through the pages in the report by either clicking on the pages listed below, or by using the keyword search tool below to find specific information within the annual report.-
 1
1 -
2
-
3
-
4
-
5
-
6
-
7
-
8
-
9
-
10
-
11
-
12
-
13
-
14
-
15
-
16
-
17
-
18
-
19
-
20
-
21
-
22
-
23
-
24
-
25
-
26
-
27
-
28
-
29
-
30
-
31
-
32
-
33
-
34
-
35
-
36
-
37
-
38
-
39
-
40
-
41
-
42
-
43
-
44
-
45
-
46
-
47
-
48
-
49
-
 50
50 -
 51
51 -
 52
52 -
 53
53 -
 54
54 -
 55
55 -
 56
56 -
 57
57 -
 58
58 -
 59
59 -
 60
60 -
 61
61 -
 62
62 -
 63
63 -
 64
64 -
 65
65 -
 66
66 -
 67
67 -
 68
68 -
 69
69 -
 70
70 -
71
-
72
-
73
-
74
-
75
-
76
-
77
-
78
-
79
-
80
-
81
-
82
-
83
-
84
-
85
-
86
-
87
-
88
-
89
-
90
-
91
-
92
-
93
-
94
-
95
-
96
-
97
-
98
-
99
-
100
-
101
-
102
-
103
-
104
-
105
-
106
-
107
-
108
-
109
-
110
-
111
-
112
-
113
-
114
-
115
-
116
-
117
-
118
-
119
-
120
-
121
-
122
-
123
-
124
-
125
-
126
-
127
-
128
-
129
-
130
-
131
-
132
-
133
-
134
-
135
-
136
-
137
-
138
-
139
-
140
-
141
-
142
-
143
-
144
-
145
-
146
-
147
-
148
-
149
-
150
-
151
-
152
-
153
-
154
-
155
-
156
-
157
-
158
-
159
-
160
-
161
-
162
-
163
-
164
-
165
-
166
-
167
-
168
-
169
-
170
-
171
-
172
-
173
-
174
-
175
-
176
-
177
-
178
-
179
-
180
-
181
-
182
-
183
-
184
-
185
-
186
 |
 |

attempt to obtain two to four quotes to determine reasonableness and comparability on a relative basis; however, the ability
to obtain reasonable and reliable broker quotes or price indications continues to be challenging. We gained an understanding
of the information used by third party pricing sources to develop their estimated values. The information obtained from third
party pricing sources was evaluated and relied upon based on the degree of market transactions supporting the price
indications and the firmness of the broker quotes. In most cases, the current market conditions caused the broker quotes to be
indicative and the price indications and broker quotes to be supported by very limited to no recent market activity. In those
instances, we weighted the third party information according to our judgment of it being a reasonable indication of the
instrument’s fair value.
Generally, pricing services’ values and broker quotes obtained on level 3 instruments were indications of value based on price
indications, market intelligence, and proprietary cash flow modeling techniques, but could not otherwise be supported by recent
trades due to the illiquidity in the markets. These values were evaluated in relation to other securities, and other broker indications,
as well as our independent knowledge of the security’s collateral. We believe that we evaluated all available information to estimate
the value of level 3 instruments. The continued decline in the amount of third party information available necessitates the further
use of internal models when valuing level 3 instruments. All of the techniques used and information obtained in the valuation
process provides a range of estimated values, which were evaluated and compared in order to establish an estimated value that,
based on management’s judgment, represented a reasonable estimate of the instrument’s fair value. It was not uncommon for the
range of value of these instruments to vary widely; in such cases, we selected an estimated value that we believed was the best
indication of value based on the yield a market participant in this current environment would expect.
Beginning in the first quarter of 2008, management established a level 3 valuation working group to evaluate the available
information pertaining to certain securities and ultimately develop a consensus estimate of the instrument’s fair value. The
process involves the gathering of multiple sources of information, including broker quotes, values provided by pricing
services, trading activity in other similar securities, market indices, and internal cash flow and pricing matrix estimates.
Participation in this working group includes the business or functional area that manages the instrument, market risk, and
finance, including the independent price verification function. Pricing estimates are derived on most illiquid instruments
weekly and at a minimum monthly, and the working group formally reviews the pricing information at least quarterly. These
reviews may include assessing an instrument’s classification in the fair value hierarchy based on the significance of the
unobservable assumptions used to estimate the fair value.
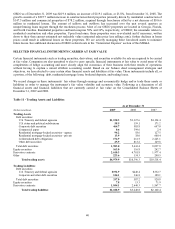
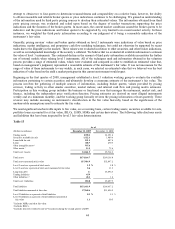
We used significant unobservable inputs to fair value, on a recurring basis, certain trading assets, securities available for sale,
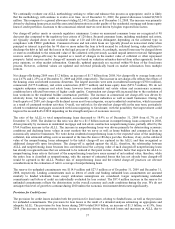
portfolio loans accounted for at fair value, IRLCs, LHFS, MSRs and certain derivatives. The following table discloses assets
and liabilities that have been impacted by level 3 fair value determinations.
Table 13
As of
(Dollars in millions) December 31, 2009 December 31, 2008
Trading assets $390.1 $1,391.4
Securities available for sale 1,322.1 1,489.6
Loans held for sale 151.5 487.4
Loans 448.7 270.3
Other intangible assets 1935.6 -
Other assets 213.5 73.6
Total level 3 assets $3,261.5 $3,712.3
Total assets $174,164.7 $189,138.0
Total assets measured at fair value $37,914.9 $32,897.2
Level 3 assets as a percent of total assets 1.9 % 2.0 %
Level 3 assets as a percent of total assets measured at fair value 8.6 11.3
Long-term debt $- $3,496.3
Trading liabilities 45.9 -
Other liabilities 2, 3 48.1 1.2
Total level 3 liabilities $94.0 $3,497.5
Total liabilities $151,633.9 $166,637.2
Total liabilities measured at fair value $7,160.6 $11,456.5
Level 3 liabilities as a percent of total liabilities 0.1 % 2.1 %
Level 3 liabilities as a percent of total liabilities measured at
fair value 1.3 30.5
1Includes MSRs carried at fair value.
2Includes IRLCs.
3Includes derivative related to sale of Visa shares during the second quarter of 2009.
44