SunTrust 2009 Annual Report Download - page 115
Download and view the complete annual report
Please find page 115 of the 2009 SunTrust annual report below. You can navigate through the pages in the report by either clicking on the pages listed below, or by using the keyword search tool below to find specific information within the annual report.-
 1
1 -
2
-
3
-
4
-
5
-
6
-
7
-
8
-
9
-
10
-
11
-
12
-
13
-
14
-
15
-
16
-
17
-
18
-
19
-
20
-
21
-
22
-
23
-
24
-
25
-
26
-
27
-
28
-
29
-
30
-
31
-
32
-
33
-
34
-
35
-
36
-
37
-
38
-
39
-
40
-
41
-
42
-
43
-
44
-
45
-
46
-
47
-
48
-
49
-
50
-
51
-
52
-
53
-
54
-
55
-
56
-
57
-
58
-
59
-
60
-
61
-
62
-
63
-
64
-
65
-
66
-
67
-
68
-
69
-
70
-
71
-
72
-
73
-
74
-
75
-
76
-
77
-
78
-
79
-
80
-
81
-
82
-
83
-
84
-
85
-
86
-
87
-
88
-
89
-
90
-
91
-
92
-
93
-
94
-
95
-
96
-
97
-
98
-
99
-
100
-
101
-
102
-
103
-
104
-
 105
105 -
 106
106 -
 107
107 -
 108
108 -
 109
109 -
 110
110 -
 111
111 -
 112
112 -
 113
113 -
 114
114 -
 115
115 -
 116
116 -
 117
117 -
 118
118 -
 119
119 -
 120
120 -
 121
121 -
 122
122 -
 123
123 -
 124
124 -
 125
125 -
126
-
127
-
128
-
129
-
130
-
131
-
132
-
133
-
134
-
135
-
136
-
137
-
138
-
139
-
140
-
141
-
142
-
143
-
144
-
145
-
146
-
147
-
148
-
149
-
150
-
151
-
152
-
153
-
154
-
155
-
156
-
157
-
158
-
159
-
160
-
161
-
162
-
163
-
164
-
165
-
166
-
167
-
168
-
169
-
170
-
171
-
172
-
173
-
174
-
175
-
176
-
177
-
178
-
179
-
180
-
181
-
182
-
183
-
184
-
185
-
186
 |
 |

SUNTRUST BANKS, INC.
Notes to Consolidated Financial Statements (Continued)
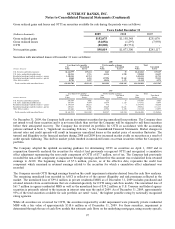
In July 2008, the Company contributed 3.6 million shares of its holdings in Coke to a charitable foundation. The contribution
resulted in a $183.4 million non-taxable gain that was recorded in the Company’s financial results. In addition, the
contribution increased Tier 1 capital by approximately $65.8 million and will reduce ongoing charitable contribution
expense.
The Company holds stock in the FHLB of Atlanta and FHLB of Cincinnati totaling $343.3 million and $493.2 million as of
December 31, 2009 and December 31, 2008, respectively. The Company accounts for the stock based on the industry
guidance in ASC 325-942, which requires the investment be carried at cost and be evaluated for impairment based on the
ultimate recoverability of the par value. The Company evaluated its holdings in FHLB stock at December 31, 2009 and
believes its holdings in the stock are ultimately recoverable at par. In addition, the Company does not have operational or
liquidity needs that would require a redemption of the stock in the foreseeable future and therefore determined that the stock
was not other-than-temporarily impaired. In February 2009, the Company repaid all of the FHLB advances outstanding and
closed out its exposures on the interest rate swaps. Approximately $150.8 million of FHLB stock was redeemed in
conjunction with the repayment of the advances.
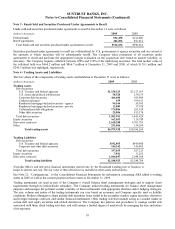
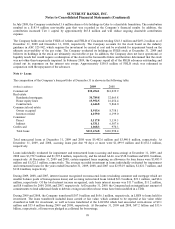
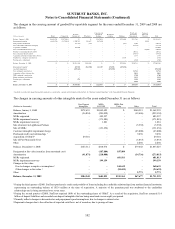
Note 6 - Loans
The composition of the Company’s loan portfolio at December 31 is shown in the following table:
(Dollars in millions) 2009 2008
Commercial $32,494.1 $41,039.9
Real estate:
Residential mortgages 30,789.8 32,065.8
Home equity lines 15,952.5 16,454.4
Construction 6,646.8 9,864.0
Commercial real estate:
Owner occupied 8,915.4 8,758.1
Investor owned 6,159.0 6,199.0
Consumer:
Direct 5,117.8 5,139.3
Indirect 6,531.1 6,507.6
Credit card 1,068.3 970.3
Total loans $113,674.8 $126,998.4
Total nonaccrual loans at December 31, 2009 and 2008 were $5,402.6 million and $3,940.0 million, respectively. At
December 31, 2009, and 2008, accruing loans past due 90 days or more were $1,499.9 million and $1,032.3 million,
respectively.
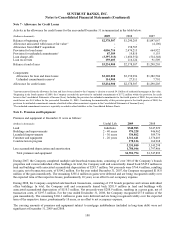
Loans individually evaluated for impairment and restructured loans (accruing and nonaccruing) at December 31, 2009, and
2008 were $3,752.5 million and $1,595.8 million, respectively, and the related ALLL was $538.0 million and $201.8 million,
respectively. At December 31, 2009 and 2008, certain impaired loans requiring an allowance for loan losses were $3,485.9
million and $1,522.3 million, respectively. The average recorded investment in loans individually evaluated for impairment
and restructured loans for the years ended December 31, 2009, 2008, and 2007 was $2,954.9 million, $1,021.7 million, and
$130.4 million, respectively.
During 2009, 2008, and 2007, interest income recognized on nonaccrual loans (excluding consumer and mortgage which are
smaller balance pools of homogeneous loans) and accruing restructured loans totaled $63.9 million, $23.1 million, and $8.6
million, respectively. Of the total interest income recognized, cash basis interest income was $11.7 million, $11.2 million,
and $8.6 million for 2009, 2008, and 2007, respectively. At December 31, 2009, the Company had an insignificant amount of
commitments to lend additional funds to debtors owing receivables whose terms have been modified in a TDR.
During 2009 and 2008, the Company transferred $307.0 million and $656.1 million, respectively, in LHFS to loans held for
investment. The loans transferred included loans carried at fair value, which continue to be reported at fair value while
classified as held for investment, as well as loans transferred at the LOCOM which had associated write-downs of $9.1
million and $35.4 million during 2009 and 2008, respectively. At December 31, 2009 and 2008, $47.2 billion and $33.6
billion, respectively, of loans were pledged as collateral for borrowings.
99