SunTrust 2009 Annual Report Download - page 160
Download and view the complete annual report
Please find page 160 of the 2009 SunTrust annual report below. You can navigate through the pages in the report by either clicking on the pages listed below, or by using the keyword search tool below to find specific information within the annual report.-
 1
1 -
2
-
3
-
4
-
5
-
6
-
7
-
8
-
9
-
10
-
11
-
12
-
13
-
14
-
15
-
16
-
17
-
18
-
19
-
20
-
21
-
22
-
23
-
24
-
25
-
26
-
27
-
28
-
29
-
30
-
31
-
32
-
33
-
34
-
35
-
36
-
37
-
38
-
39
-
40
-
41
-
42
-
43
-
44
-
45
-
46
-
47
-
48
-
49
-
50
-
51
-
52
-
53
-
54
-
55
-
56
-
57
-
58
-
59
-
60
-
61
-
62
-
63
-
64
-
65
-
66
-
67
-
68
-
69
-
70
-
71
-
72
-
73
-
74
-
75
-
76
-
77
-
78
-
79
-
80
-
81
-
82
-
83
-
84
-
85
-
86
-
87
-
88
-
89
-
90
-
91
-
92
-
93
-
94
-
95
-
96
-
97
-
98
-
99
-
100
-
101
-
102
-
103
-
104
-
105
-
106
-
107
-
108
-
109
-
110
-
111
-
112
-
113
-
114
-
115
-
116
-
117
-
118
-
119
-
120
-
121
-
122
-
123
-
124
-
125
-
126
-
127
-
128
-
129
-
130
-
131
-
132
-
133
-
134
-
135
-
136
-
137
-
138
-
139
-
140
-
141
-
142
-
143
-
144
-
145
-
146
-
147
-
148
-
149
-
 150
150 -
 151
151 -
 152
152 -
 153
153 -
 154
154 -
 155
155 -
 156
156 -
 157
157 -
 158
158 -
 159
159 -
 160
160 -
 161
161 -
 162
162 -
 163
163 -
 164
164 -
 165
165 -
 166
166 -
 167
167 -
 168
168 -
 169
169 -
 170
170 -
171
-
172
-
173
-
174
-
175
-
176
-
177
-
178
-
179
-
180
-
181
-
182
-
183
-
184
-
185
-
186
 |
 |

SUNTRUST BANKS, INC.
Notes to Consolidated Financial Statements (Continued)
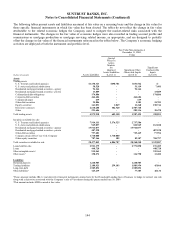
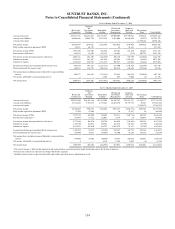
The following tables present assets and liabilities measured at fair value on a recurring basis and the change in fair value for
those specific financial instruments in which fair value has been elected. The tables do not reflect the change in fair value
attributable to the related economic hedges the Company used to mitigate the market-related risks associated with the
financial instruments. The changes in the fair value of economic hedges were also recorded in trading account profits and
commissions or mortgage production or mortgage servicing related income, as appropriate, and are designed to partially
offset the change in fair value of the financial instruments referenced in the tables below. The Company’s economic hedging
activities are deployed at both the instrument and portfolio level.
Fair Value Measurements at
December 31, 2009,
Using
(Dollars in thousands) Assets/Liabilities
Quoted
Prices In
Active
Markets
for
Identical
Assets/Liabilities
(Level 1)
Significant Other
Observable Inputs
(Level 2)
Significant
Unobservable
Inputs
(Level 3)
Assets
Trading assets
U.S. Treasury and federal agencies $1,150,323 $498,781 $651,542 $-
U.S. states and political subdivisions 58,520 - 51,119 7,401
Residential mortgage-backed securities - agency 94,164 - 94,164 -
Residential mortgage-backed securities - private 13,889 - - 13,889
Collateralized debt obligations 174,886 - - 174,886
Corporate debt securities 464,684 - 464,684 -
Commercial paper 639 - 639 -
Other debt securities 25,886 - 1,183 24,703
Equity securities 163,053 1,049 11,260 150,744
Derivative contracts 2,610,288 102,520 2,507,768 -
Other 223,606 - 205,136 18,470
Total trading assets 4,979,938 602,350 3,987,495 390,093
Securities available for sale
U.S. Treasury and federal agencies 7,914,111 5,176,525 2,737,586 -
U.S. states and political subdivisions 945,057 - 812,949 132,108
Residential mortgage-backed securities - agency 15,916,077 - 15,916,077 -
Residential mortgage-backed securities - private 407,228 - - 407,228
Other debt securities 797,403 - 719,449 77,954
Common stock of The Coca-Cola Company 1,710,000 1,710,000 - -
Other equity securities 787,166 182 82,187 704,797
Total securities available for sale 28,477,042 6,886,707 20,268,248 1,322,087
Loans held for sale 2,923,375 - 2,771,890 151,485
Loans 448,720 - - 448,720
Other intangible assets 2935,561 - - 935,561
Other assets 1150,272 - 136,790 13,482
Liabilities
Brokered deposits 1,260,505 - 1,260,505 -
Trading liabilities 2,188,923 259,103 1,883,954 45,866
Long-term debt 3,585,892 - 3,585,892 -
Other liabilities 1125,239 - 77,105 48,134
1These amounts include IRLCs and derivative financial instruments entered into by the Household Lending line of business to hedge its interest rate risk
along with a derivative associated with the Company’s sale of Visa shares during the quarter ended June 30, 2009.
2This amount includes MSRs carried at fair value.
144