SunTrust 2009 Annual Report Download - page 35
Download and view the complete annual report
Please find page 35 of the 2009 SunTrust annual report below. You can navigate through the pages in the report by either clicking on the pages listed below, or by using the keyword search tool below to find specific information within the annual report.-
 1
1 -
2
-
3
-
4
-
5
-
6
-
7
-
8
-
9
-
10
-
11
-
12
-
13
-
14
-
15
-
16
-
17
-
18
-
19
-
20
-
21
-
22
-
23
-
24
-
 25
25 -
 26
26 -
 27
27 -
 28
28 -
 29
29 -
 30
30 -
 31
31 -
 32
32 -
 33
33 -
 34
34 -
 35
35 -
 36
36 -
 37
37 -
 38
38 -
 39
39 -
 40
40 -
 41
41 -
 42
42 -
 43
43 -
 44
44 -
 45
45 -
46
-
47
-
48
-
49
-
50
-
51
-
52
-
53
-
54
-
55
-
56
-
57
-
58
-
59
-
60
-
61
-
62
-
63
-
64
-
65
-
66
-
67
-
68
-
69
-
70
-
71
-
72
-
73
-
74
-
75
-
76
-
77
-
78
-
79
-
80
-
81
-
82
-
83
-
84
-
85
-
86
-
87
-
88
-
89
-
90
-
91
-
92
-
93
-
94
-
95
-
96
-
97
-
98
-
99
-
100
-
101
-
102
-
103
-
104
-
105
-
106
-
107
-
108
-
109
-
110
-
111
-
112
-
113
-
114
-
115
-
116
-
117
-
118
-
119
-
120
-
121
-
122
-
123
-
124
-
125
-
126
-
127
-
128
-
129
-
130
-
131
-
132
-
133
-
134
-
135
-
136
-
137
-
138
-
139
-
140
-
141
-
142
-
143
-
144
-
145
-
146
-
147
-
148
-
149
-
150
-
151
-
152
-
153
-
154
-
155
-
156
-
157
-
158
-
159
-
160
-
161
-
162
-
163
-
164
-
165
-
166
-
167
-
168
-
169
-
170
-
171
-
172
-
173
-
174
-
175
-
176
-
177
-
178
-
179
-
180
-
181
-
182
-
183
-
184
-
185
-
186
 |
 |

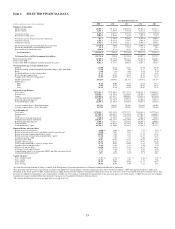
Item 6. SELECTED FINANCIAL DATA
Year Ended December 31
(Dollars in millions, except per share and other data) 2009 2008 2007 2006 2005
Summary of Operations
Interest income $6,709.7 $8,327.4 $10,035.9 $9,792.0 $7,731.3
Interest expense 2,244.1 3,707.7 5,316.4 5,131.6 3,152.3
Net interest income 4,465.6 4,619.7 4,719.5 4,660.4 4,579.0
Provision for credit losses 34,063.9 2,474.2 664.9 262.5 176.9
Net interest income after provision for credit losses 401.7 2,145.5 4,054.6 4,397.9 4,402.1
Noninterest income 3,710.3 4,473.5 3,428.7 3,468.4 3,155.0
Noninterest expense 6,562.4 5,879.0 5,221.1 4,866.5 4,676.2
Income/(loss) before provision/(benefit) for income taxes (2,450.4) 740.0 2,262.2 2,999.8 2,880.9
Net income attributable to noncontrolling interest 12.1 11.5 12.7 13.4 14.5
Provision/(benefit) for income taxes (898.8) (67.3) 615.5 869.0 879.2
Net income/(loss) ($1,563.7) $795.8 $1,634.0 $2,117.4 $1,987.2
Net income/(loss) available to common shareholders ($1,733.4) $741.0 $1,593.0 $2,097.5 $1,975.5
Net interest income-FTE 1$4,589.0 $4,737.2 $4,822.2 $4,748.4 $4,654.5
Total revenue-FTE 18,299.3 9,210.6 8,250.9 8,216.8 7,809.5
Total revenue-FTE excluding net securities gains/(losses), net18,201.2 8,137.3 8,007.8 8,267.3 7,816.7
Net income/(loss) per average common share 2
Diluted ($3.98) $2.12 $4.52 $5.78 $5.44
Diluted excluding goodwill/intangible impairment charges, other than MSRs1(2.34) 2.19 4.39 5.77 6.72
Basic (3.98) 2.12 4.56 5.84 5.50
Dividends paid per average common share 0.22 2.85 2.92 2.44 2.20
Book value per common share 35.29 48.74 50.72 49.12 47.33
Tangible book value per common share122.59 28.69 30.11 28.66 27.16
Market capitalization $10,128 $10,472 $21,772 $29,972 $26,338
Market price:
High 30.18 70.00 94.18 85.64 75.77
Low 6.00 19.75 60.02 69.68 65.32
Close 20.29 29.54 62.49 84.45 72.76
Selected Average Balances
Total assets $175,442.4 $175,848.3 $177,795.5 $180,315.1 $168,088.8
Earning assets 150,908.4 152,748.6 155,204.4 158,428.7 146,639.8
Loans 121,040.6 125,432.7 120,080.6 119,645.2 108,742.0
Consumer and commercial deposits 113,164.0 101,332.8 98,020.2 97,175.3 93,355.0
Brokered and foreign deposits 6,082.2 14,743.5 21,856.4 26,490.2 17,051.5
Total shareholders’ equity 22,286.1 18,596.3 17,928.4 17,697.7 16,732.9
Average common shares - diluted (thousands) 435,328 350,183 352,688 362,802 363,454
Average common shares - basic (thousands) 435,328 348,919 349,346 359,413 359,066
As of December 31
Total assets $174,164.7 $189,138.0 $179,573.9 $182,161.6 $179,712.8
Earning assets 147,896.2 156,016.5 154,397.2 159,063.8 156,640.9
Loans 113,674.8 126,998.4 122,319.0 121,454.3 114,554.9
Allowance for loan and lease losses 3,120.0 2,351.0 1,282.5 1,044.5 1,028.1
Consumer and commercial deposits 116,303.5 105,275.7 101,870.0 99,775.9 97,572.4
Brokered and foreign deposits 5,560.1 8,052.7 15,972.6 24,245.7 24,480.8
Long-term debt 17,489.5 26,812.4 22,956.5 18,992.9 20,779.2
Total shareholders’ equity 22,530.9 22,500.8 18,169.9 17,932.2 17,133.6
Financial Ratios and Other Data
Return on average total assets (0.89) % 0.45 % 0.92 % 1.17 % 1.18 %
Return on average assets less net unrealized securities gains/(losses) 1(0.96) 0.05 0.81 1.17 1.17
Return on average common shareholders’ equity (10.07) 4.20 9.14 11.95 11.81
Return on average realized common shareholders’ equity 1(11.12) 0.16 8.52 12.53 12.45
Net interest margin - FTE 3.04 3.10 3.11 3.00 3.17
Efficiency ratio - FTE 79.07 63.83 63.28 59.23 59.88
Tangible efficiency ratio 169.35 62.51 62.11 57.97 58.36
Total average shareholders’ equity to average assets 12.70 10.58 10.08 9.81 9.95
Tangible equity to tangible assets 19.66 8.46 6.38 6.10 5.70
Effective tax rate (benefit) (36.50) (9.23) 27.21 28.97 30.52
Allowance to year-end total loans 2.76 1.86 1.05 0.86 0.90
Nonperforming assets to total loans plus OREO and other repossessed assets 5.33 3.49 1.35 0.49 0.29
Common dividend payout ratio 4N/A 135.6 64.5 41.9 40.2
Capital Adequacy
Tier 1 common equity 7.67 % 5.83 % 5.27 % 5.66 % 5.52 %
Tier 1 capital 12.96 10.87 6.93 7.72 7.01
Total capital 16.43 14.04 10.30 11.11 10.57
Tier 1 leverage 10.90 10.45 6.90 7.23 6.65
1See Non-GAAP reconcilements in Tables 21 and 22 of the Management’s Discussion and Analysis of Financial Condition and Results of Operations.
2Prior period amounts have been recalculated in accordance with updated accounting guidance related to earnings per share, that was effective January 1, 2009 and required retrospective application.
3Beginning in the fourth quarter of 2009, SunTrust began recording the provision for unfunded commitments within the provision for credit losses in the Consolidated Statements of Income/(Loss). The
provision for unfunded commitments for the fourth quarter of 2009 was $57.2 million. Considering the immateriality of this provision, prior to the fourth quarter of 2009, the provision for unfunded
commitments remains classified within other noninterest expense in the Consolidated Statements of Income/(Loss).
4The common dividend payout ratio is not applicable in a period of net loss.
19