SunTrust 2009 Annual Report Download - page 43
Download and view the complete annual report
Please find page 43 of the 2009 SunTrust annual report below. You can navigate through the pages in the report by either clicking on the pages listed below, or by using the keyword search tool below to find specific information within the annual report.-
 1
1 -
2
-
3
-
4
-
5
-
6
-
7
-
8
-
9
-
10
-
11
-
12
-
13
-
14
-
15
-
16
-
17
-
18
-
19
-
20
-
21
-
22
-
23
-
24
-
25
-
26
-
27
-
28
-
29
-
30
-
31
-
32
-
 33
33 -
 34
34 -
 35
35 -
 36
36 -
 37
37 -
 38
38 -
 39
39 -
 40
40 -
 41
41 -
 42
42 -
 43
43 -
 44
44 -
 45
45 -
 46
46 -
 47
47 -
 48
48 -
 49
49 -
 50
50 -
 51
51 -
 52
52 -
 53
53 -
54
-
55
-
56
-
57
-
58
-
59
-
60
-
61
-
62
-
63
-
64
-
65
-
66
-
67
-
68
-
69
-
70
-
71
-
72
-
73
-
74
-
75
-
76
-
77
-
78
-
79
-
80
-
81
-
82
-
83
-
84
-
85
-
86
-
87
-
88
-
89
-
90
-
91
-
92
-
93
-
94
-
95
-
96
-
97
-
98
-
99
-
100
-
101
-
102
-
103
-
104
-
105
-
106
-
107
-
108
-
109
-
110
-
111
-
112
-
113
-
114
-
115
-
116
-
117
-
118
-
119
-
120
-
121
-
122
-
123
-
124
-
125
-
126
-
127
-
128
-
129
-
130
-
131
-
132
-
133
-
134
-
135
-
136
-
137
-
138
-
139
-
140
-
141
-
142
-
143
-
144
-
145
-
146
-
147
-
148
-
149
-
150
-
151
-
152
-
153
-
154
-
155
-
156
-
157
-
158
-
159
-
160
-
161
-
162
-
163
-
164
-
165
-
166
-
167
-
168
-
169
-
170
-
171
-
172
-
173
-
174
-
175
-
176
-
177
-
178
-
179
-
180
-
181
-
182
-
183
-
184
-
185
-
186
 |
 |
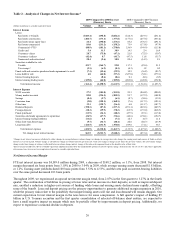
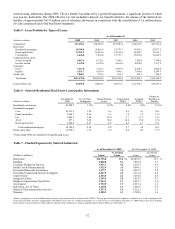
Average earning assets decreased $1.8 billion, or 1.2%, from 2008. Average loans decreased $4.4 billion, or 3.5%. The
decline is attributable to a $4.8 billion, or 44.7%, reduction in real estate construction loans, a $3.0 billion, or 9.4%, reduction
in real estate 1-4 family residential loans, and a $1.7 billion, or 4.4%, reduction in commercial loans. The decreases in real
estate construction, 1-4 family residential loans and commercial loans were partially offset by increases in the commercial
real estate loan portfolio of $1.6 billion, or 11.5%, as well as a $3.0 billion, or 104.8%, increase in nonperforming and
restructured loans. To offset the decline in loans, average securities available for sale increased $6.7 billion, or 50.6%, from
2008 due to a $4.6 billion increase in MBS and a $2.1 billion increase in U.S. Treasury and agency securities.
Yields on average earning assets declined 100 basis points from 2008 to 2009 driven by declines in market interest rates. Our
loan portfolio yielded 4.66% for the year 2009, down 95 basis points from 2008. A large percentage of our commercial loans
are variable rate indexed to one month LIBOR. In order to manage interest rate risk, we utilized receive fixed/pay floating
interest rate swaps to hedge interest income in a declining rate environment. That interest rate risk management strategy
along with increased swap-related notional balances ($8.6 billion of additional floating rate commercial loans were swapped
to fixed rate) and lower rates in 2009 resulted in swap income increasing from $229.0 million in 2008 to $539.5 million in
2009. While the underlying loans swapped to fixed are classified as both commercial real estate and commercial, all of the
swap income is recorded as interest on commercial loans. The classification of all swap income in the commercial loan
category, combined with the increased notional value of received fixed swaps and the declining balance of commercial loans,
produced a significantly smaller decline in reported commercial loan yields as compared to underlying rate indices. In
addition, loan-related interest income was augmented in 2009 by our loan pricing initiatives.
Average interest earning trading assets declined by $3.8 billion, or 49.3%. Despite the decline in trading assets, we continue
to use this portfolio as part of our overall asset/liability management; however, the size and nature of trading assets will
fluctuate over various economic cycles. Average LHFS were $5.2 billion during 2009, an increase of 2.4% from the prior
year. The increase in LHFS occurred as a result of increased mortgage loan production.
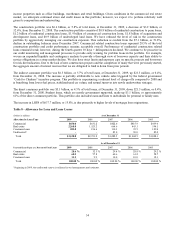
Average consumer and commercial deposits increased $11.8 billion, or 11.7%, in 2009 compared to 2008. This growth
consisted of increases of $5.3 billion, or 20.0%, in money market accounts, $3.3 billion, or 15.8%, in demand deposits, $2.5
billion, or 12.0%, in NOW accounts, and $819.1 million, or 2.8%, in time deposits. Deposit growth was the result of
marketing campaigns, competitive pricing, and clients’ increased preference for the security of insured deposit products.
However, a portion of the deposit growth is related to the industry-wide flight to the safety of insured deposits and reduced
client demand for sweep accounts due to the low interest rate environment. The overall growth in consumer and commercial
deposits allowed for a reduction in other funding sources, including $4.8 billion of brokered deposits, $3.8 billion of foreign
deposits, and $2.8 billion of long-term debt. Overall, average interest-bearing liabilities declined $7.0 billion, or 5.4%. We
continue to pursue deposit growth initiatives to increase our presence in specific markets within our footprint. Competition
for deposits remains strong, and as a result, deposit pricing pressure remains across our footprint. Despite these challenging
market conditions, we have used a combination of regional and product-specific pricing initiatives to balance margin and
volume, while still growing our average deposit balances. We continue to believe that we are also benefiting from a number
of actions taken to improve marketplace awareness and client service. The “Live Solid. Bank Solid.” branding campaign
continues to be very well received and we believe it is helping drive client acquisition. We also continue to refine pricing
tactics to be competitive while maintaining deposit rates that are attractive to our clients. Notwithstanding these deposit
generation successes, some of the deposit growth is due to seasonality and the economic environment. Deposit balances are
expected to decline modestly in the first quarter related to seasonality, and further over time as the economy improves.
During 2009, the interest rate environment was characterized by lower rates, yet a steeper yield curve versus 2008. More
specifically, the Fed funds target rate averaged 0.25%, a decrease of 183 basis points, the Prime rate averaged 3.25%, a
decrease of 183 basis points, one-month LIBOR averaged 0.33%, a decrease of 235 basis points, five-year swaps averaged
2.65%, a decrease of 104 basis points, and ten-year swaps averaged 3.44%, a decrease of 80 basis points. Rates paid on
deposits, our most significant funding source, tend to track movements in one-month LIBOR, while our fixed rate loan yields
tend to track movements in the five-year swap rate. However, due to the competition and customer demands surrounding
deposits, deposit pricing has reached an effective floor in some products, as evidenced by the 92 basis point decline in the
average rate paid on interest-bearing consumer and commercial deposits versus the 235 basis point decline noted in
one-month LIBOR.
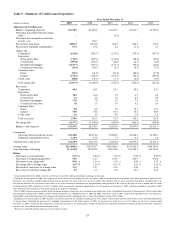
Foregone interest income from nonperforming loans reduced net interest margin by 21 basis points for 2009 as average
nonaccrual loans increased $2.3 billion, or 82.7% from 2008. See additional discussion of our expectations for future levels
of credit quality in the “Allowance for Credit Losses”, “Provision for Credit Losses”, and “Nonperforming Assets” sections
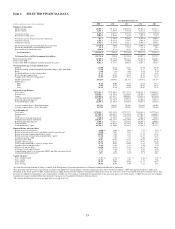
of this MD&A. Tables 1 and 2 contain more detailed information concerning average balances, yields earned, and rates paid.
27