SunTrust 2009 Annual Report Download - page 85
Download and view the complete annual report
Please find page 85 of the 2009 SunTrust annual report below. You can navigate through the pages in the report by either clicking on the pages listed below, or by using the keyword search tool below to find specific information within the annual report.-
 1
1 -
2
-
3
-
4
-
5
-
6
-
7
-
8
-
9
-
10
-
11
-
12
-
13
-
14
-
15
-
16
-
17
-
18
-
19
-
20
-
21
-
22
-
23
-
24
-
25
-
26
-
27
-
28
-
29
-
30
-
31
-
32
-
33
-
34
-
35
-
36
-
37
-
38
-
39
-
40
-
41
-
42
-
43
-
44
-
45
-
46
-
47
-
48
-
49
-
50
-
51
-
52
-
53
-
54
-
55
-
56
-
57
-
58
-
59
-
60
-
61
-
62
-
63
-
64
-
65
-
66
-
67
-
68
-
69
-
70
-
71
-
72
-
73
-
74
-
 75
75 -
 76
76 -
 77
77 -
 78
78 -
 79
79 -
 80
80 -
 81
81 -
 82
82 -
 83
83 -
 84
84 -
 85
85 -
 86
86 -
 87
87 -
 88
88 -
 89
89 -
 90
90 -
 91
91 -
 92
92 -
 93
93 -
 94
94 -
 95
95 -
96
-
97
-
98
-
99
-
100
-
101
-
102
-
103
-
104
-
105
-
106
-
107
-
108
-
109
-
110
-
111
-
112
-
113
-
114
-
115
-
116
-
117
-
118
-
119
-
120
-
121
-
122
-
123
-
124
-
125
-
126
-
127
-
128
-
129
-
130
-
131
-
132
-
133
-
134
-
135
-
136
-
137
-
138
-
139
-
140
-
141
-
142
-
143
-
144
-
145
-
146
-
147
-
148
-
149
-
150
-
151
-
152
-
153
-
154
-
155
-
156
-
157
-
158
-
159
-
160
-
161
-
162
-
163
-
164
-
165
-
166
-
167
-
168
-
169
-
170
-
171
-
172
-
173
-
174
-
175
-
176
-
177
-
178
-
179
-
180
-
181
-
182
-
183
-
184
-
185
-
186
 |
 |

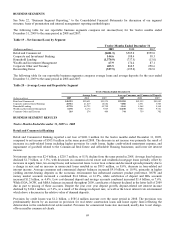
BUSINESS SEGMENTS
See Note 22, “Business Segment Reporting,” to the Consolidated Financial Statements for discussion of our segment
structure, basis of presentation and internal management reporting methodologies.
The following table for our reportable business segments compares net income/(loss) for the twelve months ended
December 31, 2009 to the same period in 2008 and 2007:
Table 19 – Net Income/(Loss) by Segment
Twelve Months Ended December 31
(Dollars in millions) 2009 2008 2007
Retail and Commercial ($481.3) $505.0 $959.0
Corporate and Investment Banking 144.6 188.4 58.3
Household Lending (1,370.9) (737.5) (13.0)
Wealth and Investment Management 67.9 174.4 87.1
Corporate Other and Treasury 403.5 860.5 250.6
Reconciling Items (327.5) (195.0) 292.0
The following table for our reportable business segments compares average loans and average deposits for the year ended
December 31, 2009 to the same period in 2008 and 2007:
Table 20 – Average Loans and Deposits by Segment
Twelve Months Ended December 31
Average Loans Average Consumer and Commercial Deposits
(Dollars in millions) 2009 2008 2007 2009 2008 2007
Retail and Commercial $48,993 $50,651 $51,274 $91,290 $82,339 $81,889
Corporate and Investment Banking 20,921 21,619 16,682 7,008 6,551 3,503
Household Lending 42,738 44,733 43,790 3,161 2,268 2,168
Wealth and Investment Management 8,198 8,174 7,965 11,030 9,506 9,781
Corporate Other and Treasury 203 274 404 744 759 702
BUSINESS SEGMENT RESULTS
Twelve Months Ended December 31, 2009 vs. 2008
Retail and Commercial Banking
Retail and Commercial Banking reported a net loss of $481.3 million for the twelve months ended December 31, 2009,
compared to net income of $505.0 million in the same period 2008. The decrease in net income was primarily the result of
increases in credit-related losses including higher provision for credit losses, higher credit-related noninterest expense, and
impairment of goodwill related to the Commercial Real Estate and Affordable Housing businesses, and lower net interest
income.
Net interest income was $2.4 billion, a $210.7 million, or 8.1% decline from the same period in 2008. Average loan balances
declined $1.7 billion, or 3.3%, with decreases in commercial real estate and residential mortgage loans partially offset by
increases in equity lines, tax-exempt loans, and nonaccrual loans. Lower loan volume and decreased spreads primarily due to
a change in mix and an increase in nonaccrual loans resulted in an $89.5 million, or 8.6%, decrease in loan-related net
interest income. Average consumer and commercial deposit balances increased $9.0 billion, or 10.9%, primarily in higher
yielding interest-bearing deposits as the economic environment has influenced customer product preference. NOW and
money market accounts increased a combined $6.4 billion, or 16.9%, while certificates of deposit and IRA accounts
increased $1.2 billion, or 4.4%. Low cost demand deposit and savings accounts combined increased $1.4 billion, or 7.6%.
While DDA, NOW, and MMA balances increased throughout 2009, certificates of deposit declined in the latter half of 2009
due in part to pricing of these accounts. Despite the year over year deposit growth, deposit-related net interest income
declined by $104.1 million, or 5.6%, as a result of the change in deposit mix, as well as the lower interest rate environment
which drove a decrease in the relative value of demand deposits.
Provision for credit losses was $1.2 billion, a $585.4 million increase over the same period in 2008. The provision was
predominantly driven by an increase in provision for real estate construction loans and home equity lines reflecting the
deterioration in the residential real estate market. Provision for commercial loans also increased, mostly due to net charge-
offs on smaller commercial clients.
69