SunTrust 2009 Annual Report Download - page 58
Download and view the complete annual report
Please find page 58 of the 2009 SunTrust annual report below. You can navigate through the pages in the report by either clicking on the pages listed below, or by using the keyword search tool below to find specific information within the annual report.-
 1
1 -
2
-
3
-
4
-
5
-
6
-
7
-
8
-
9
-
10
-
11
-
12
-
13
-
14
-
15
-
16
-
17
-
18
-
19
-
20
-
21
-
22
-
23
-
24
-
25
-
26
-
27
-
28
-
29
-
30
-
31
-
32
-
33
-
34
-
35
-
36
-
37
-
38
-
39
-
40
-
41
-
42
-
43
-
44
-
45
-
46
-
47
-
 48
48 -
 49
49 -
 50
50 -
 51
51 -
 52
52 -
 53
53 -
 54
54 -
 55
55 -
 56
56 -
 57
57 -
 58
58 -
 59
59 -
 60
60 -
 61
61 -
 62
62 -
 63
63 -
 64
64 -
 65
65 -
 66
66 -
 67
67 -
 68
68 -
69
-
70
-
71
-
72
-
73
-
74
-
75
-
76
-
77
-
78
-
79
-
80
-
81
-
82
-
83
-
84
-
85
-
86
-
87
-
88
-
89
-
90
-
91
-
92
-
93
-
94
-
95
-
96
-
97
-
98
-
99
-
100
-
101
-
102
-
103
-
104
-
105
-
106
-
107
-
108
-
109
-
110
-
111
-
112
-
113
-
114
-
115
-
116
-
117
-
118
-
119
-
120
-
121
-
122
-
123
-
124
-
125
-
126
-
127
-
128
-
129
-
130
-
131
-
132
-
133
-
134
-
135
-
136
-
137
-
138
-
139
-
140
-
141
-
142
-
143
-
144
-
145
-
146
-
147
-
148
-
149
-
150
-
151
-
152
-
153
-
154
-
155
-
156
-
157
-
158
-
159
-
160
-
161
-
162
-
163
-
164
-
165
-
166
-
167
-
168
-
169
-
170
-
171
-
172
-
173
-
174
-
175
-
176
-
177
-
178
-
179
-
180
-
181
-
182
-
183
-
184
-
185
-
186
 |
 |

action in response to the unprecedented market events during the third quarter and to protect investors in the Fund from
losses associated with this specific security. When purchased by the Fund, the Lehman Brothers security was rated A-1/P-1
and was a Tier 1 eligible security. During 2008, we recorded a pre-tax market valuation loss of $63.8 million as a result of
the purchase. During 2009, we sold this security, recognizing a gain for the year of $2.8 million. We evaluated this
transaction under the applicable accounting guidance and concluded that we were not the primary beneficiary and therefore
consolidation of the Fund was not appropriate.
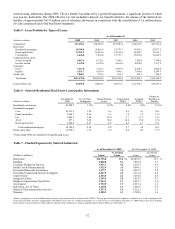
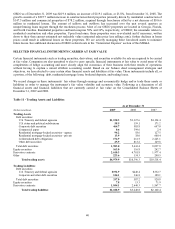
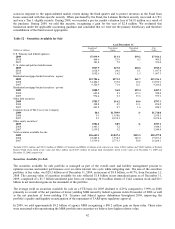
Table 12 – Securities Available for Sale
As of December 31
(Dollars in millions)
Amortized
Cost
Unrealized
Gains
Unrealized
Losses
Fair
Value
U.S. Treasury and federal agencies
2009 $7,939.9 $13.4 $39.2 $7,914.1
2008 464.6 21.9 0.3 486.2
2007 383.2 7.2 - 390.4
U. S. states and political subdivisions
2009 $927.9 $27.8 $10.6 $945.1
2008 1,018.9 24.6 6.1 1,037.4
2007 1,052.6 16.2 1.5 1,067.3
Residential mortgage-backed securities - agency
2009 $15,704.6 $273.2 $61.7 $15,916.1
2008 14,424.5 135.8 10.2 14,550.1
2007 9,326.9 71.4 12.1 9,386.2
Residential mortgage-backed securities - private
2009 $500.7 $6.0 $99.4 $407.3
2008 629.2 8.3 115.3 522.2
2007 994.4 0.3 35.6 959.1
Other debt securities
2009 $785.7 $16.2 $4.6 $797.3
2008 302.8 4.5 13.1 294.2
2007 243.2 0.7 1.6 242.3
Common stock of The Coca-Cola Company
2009 $0.1 $1,709.9 $- $1,710.0
2008 0.1 1,358.0 - 1,358.1
2007 0.1 2,674.3 - 2,674.4
Other equity securities1
2009 $786.2 $0.9 $- $787.1
2008 1,443.1 5.2 - 1,448.3
2007 1,539.2 5.2 - 1,544.4
Total securities available for sale
2009 $26,645.1 $2,047.4 $215.5 $28,477.0
2008 18,283.2 1,558.3 145.0 19,696.5
2007 13,539.6 2,775.3 50.8 16,264.1
1Includes $343.3 million and $493.2 million of FHLB of Cincinnati and FHLB of Atlanta stock stated at par value, $360.4 million and $360.9 million of Federal
Reserve Bank stock stated at par value and $82.2 million and $588.5 million of mutual fund investments stated at fair value as of December 31, 2009 and
December 31, 2008, respectively.
Securities Available for Sale
The securities available for sale portfolio is managed as part of the overall asset and liability management process to
optimize income and market performance over an entire interest rate cycle while mitigating risk. The size of the securities
portfolio, at fair value, was $28.5 billion as of December 31, 2009, an increase of $8.8 billion, or 44.7%, from December 31,
2008. The carrying value of securities available for sale reflected $1.8 billion in net unrealized gains as of December 31,
2009, comprised of a $1.7 billion unrealized gain from our remaining 30.0 million shares of Coke common stock and $0.1
billion in net unrealized gains on the remainder of the portfolio.
The average yield on securities available for sale on a FTE basis for 2009 declined to 4.23% compared to 5.99% in 2008
primarily as a result of the net purchase of lower-yielding MBS issued by federal agencies in late December of 2008 as well
as the net purchase of lower-yielding U.S. Treasury and federal agency debentures throughout 2009, improving the
portfolio’s quality and liquidity in anticipation of the repayment of TARP upon regulatory approval.
In 2009, we sold approximately $9.2 billion of agency MBS recognizing a $90.2 million gain on those sales. These sales
were associated with repositioning the MBS portfolio into securities we believe have higher relative value.
42