SunTrust 2009 Annual Report Download - page 46
Download and view the complete annual report
Please find page 46 of the 2009 SunTrust annual report below. You can navigate through the pages in the report by either clicking on the pages listed below, or by using the keyword search tool below to find specific information within the annual report.-
 1
1 -
2
-
3
-
4
-
5
-
6
-
7
-
8
-
9
-
10
-
11
-
12
-
13
-
14
-
15
-
16
-
17
-
18
-
19
-
20
-
21
-
22
-
23
-
24
-
25
-
26
-
27
-
28
-
29
-
30
-
31
-
32
-
33
-
34
-
35
-
 36
36 -
 37
37 -
 38
38 -
 39
39 -
 40
40 -
 41
41 -
 42
42 -
 43
43 -
 44
44 -
 45
45 -
 46
46 -
 47
47 -
 48
48 -
 49
49 -
 50
50 -
 51
51 -
 52
52 -
 53
53 -
 54
54 -
 55
55 -
 56
56 -
57
-
58
-
59
-
60
-
61
-
62
-
63
-
64
-
65
-
66
-
67
-
68
-
69
-
70
-
71
-
72
-
73
-
74
-
75
-
76
-
77
-
78
-
79
-
80
-
81
-
82
-
83
-
84
-
85
-
86
-
87
-
88
-
89
-
90
-
91
-
92
-
93
-
94
-
95
-
96
-
97
-
98
-
99
-
100
-
101
-
102
-
103
-
104
-
105
-
106
-
107
-
108
-
109
-
110
-
111
-
112
-
113
-
114
-
115
-
116
-
117
-
118
-
119
-
120
-
121
-
122
-
123
-
124
-
125
-
126
-
127
-
128
-
129
-
130
-
131
-
132
-
133
-
134
-
135
-
136
-
137
-
138
-
139
-
140
-
141
-
142
-
143
-
144
-
145
-
146
-
147
-
148
-
149
-
150
-
151
-
152
-
153
-
154
-
155
-
156
-
157
-
158
-
159
-
160
-
161
-
162
-
163
-
164
-
165
-
166
-
167
-
168
-
169
-
170
-
171
-
172
-
173
-
174
-
175
-
176
-
177
-
178
-
179
-
180
-
181
-
182
-
183
-
184
-
185
-
186
 |
 |

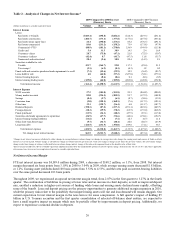
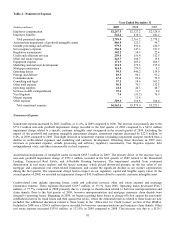
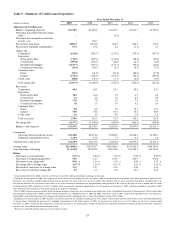
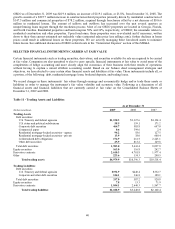
Table 4 - Noninterest Expense
Year Ended December 31
(Dollars in millions) 2009 2008 2007
Employee compensation $2,257.5 $2,327.2 $2,329.0
Employee benefits 542.4 434.0 441.2
Total personnel expense 2,799.9 2,761.2 2,770.2
Amortization/impairment of goodwill/intangible assets 806.8 121.3 96.7
Outside processing and software 579.3 492.6 410.9
Net occupancy expense 356.8 347.3 351.2
Regulatory assessments 302.2 54.9 22.4
Credit and collection services 259.4 156.4 112.5
Other real estate expense 243.7 104.7 15.8
Equipment expense 171.9 203.2 206.5
Marketing and customer development 151.5 372.2 195.0
Mortgage reinsurance 114.9 179.9 0.2
Operating losses 99.5 446.2 134.0
Postage and delivery 83.9 90.1 93.2
Communications 67.4 69.4 79.0
Consulting and legal 57.5 58.6 101.2
Other staff expense 50.8 70.3 132.5
Operating supplies 41.0 44.3 48.7
Net loss on debt extinguishment 39.4 11.7 9.8
Visa litigation 7.0 (33.5) 76.9
Merger expense -13.4 -
Other expense 329.5 314.8 364.4
Total noninterest expense $6,562.4 $5,879.0 $5,221.1
Noninterest Expense
Noninterest expense increased by $683.4 million, or 11.6%, in 2009 compared to 2008. The increase was primarily due to the
$751.2 million non-cash goodwill impairment charge recorded in the first quarter of 2009 compared to a $45.0 million
impairment charge related to a specific customer intangible asset recognized in the second quarter of 2008. Excluding the
impact of the goodwill and customer intangible impairment charges, noninterest expense decreased by $22.8 million, or
0.4%, in 2009 compared to 2008. This slight decrease in noninterest expense (excluding impairment charges) resulted from a
decline in credit-related expenses and marketing and customer development. Offsetting these decreases in 2009 were
increases in personnel expense, outside processing and software, regulatory assessments, Visa litigation expense, debt
extinguishment costs, and other economically cyclical expenses.
Amortization/impairment of intangible assets increased $685.5 million in 2009. The primary driver of the increase was a
non-cash goodwill impairment charge of $751.2 million recorded in the first quarter of 2009 related to the Household
Lending, Commercial Real Estate, and Affordable Housing businesses. The impairment resulted from continued
deterioration in real estate markets and the macro economy, which placed downward pressure on the fair value of our
mortgage and commercial real estate-related businesses, and caused the significant decline in our market capitalization
during the first quarter. The impairment charge had no impact on our regulatory capital and tangible equity ratios. In the
second quarter of 2008, we recorded an impairment charge of $45.0 million related to a specific customer intangible asset.
Credit-related costs include operating losses, credit and collection services, other real estate expense and mortgage
reinsurance expense. These expenses decreased $169.7 million, or 19.1%, from 2008. Operating losses decreased $346.7
million, or 77.7%, compared to 2008 primarily due to a change in classification related to borrower misrepresentation and
claim denials. Prior to the first quarter of 2009, borrower misrepresentation and mortgage insurance claim denials were
charged to operating losses. Beginning in 2009, we began recording these losses as charge-offs first against the previously
established reserves for fraud losses and then against the ALLL, where the estimated reserves related to these loans are now
included. See additional discussion related to these losses in the “Allowance for Credit Losses” section of this MD&A.
Included in 2008 was a $206.9 million reserve recorded for borrower misrepresentations and insurance claim denials. Other
real estate expense increased $139.0 million, or 132.8%, in 2009 compared to 2008. This increase was due to a $129.1
30