SunTrust 2009 Annual Report Download - page 164
Download and view the complete annual report
Please find page 164 of the 2009 SunTrust annual report below. You can navigate through the pages in the report by either clicking on the pages listed below, or by using the keyword search tool below to find specific information within the annual report.-
 1
1 -
2
-
3
-
4
-
5
-
6
-
7
-
8
-
9
-
10
-
11
-
12
-
13
-
14
-
15
-
16
-
17
-
18
-
19
-
20
-
21
-
22
-
23
-
24
-
25
-
26
-
27
-
28
-
29
-
30
-
31
-
32
-
33
-
34
-
35
-
36
-
37
-
38
-
39
-
40
-
41
-
42
-
43
-
44
-
45
-
46
-
47
-
48
-
49
-
50
-
51
-
52
-
53
-
54
-
55
-
56
-
57
-
58
-
59
-
60
-
61
-
62
-
63
-
64
-
65
-
66
-
67
-
68
-
69
-
70
-
71
-
72
-
73
-
74
-
75
-
76
-
77
-
78
-
79
-
80
-
81
-
82
-
83
-
84
-
85
-
86
-
87
-
88
-
89
-
90
-
91
-
92
-
93
-
94
-
95
-
96
-
97
-
98
-
99
-
100
-
101
-
102
-
103
-
104
-
105
-
106
-
107
-
108
-
109
-
110
-
111
-
112
-
113
-
114
-
115
-
116
-
117
-
118
-
119
-
120
-
121
-
122
-
123
-
124
-
125
-
126
-
127
-
128
-
129
-
130
-
131
-
132
-
133
-
134
-
135
-
136
-
137
-
138
-
139
-
140
-
141
-
142
-
143
-
144
-
145
-
146
-
147
-
148
-
149
-
150
-
151
-
152
-
153
-
 154
154 -
 155
155 -
 156
156 -
 157
157 -
 158
158 -
 159
159 -
 160
160 -
 161
161 -
 162
162 -
 163
163 -
 164
164 -
 165
165 -
 166
166 -
 167
167 -
 168
168 -
 169
169 -
 170
170 -
 171
171 -
 172
172 -
 173
173 -
 174
174 -
175
-
176
-
177
-
178
-
179
-
180
-
181
-
182
-
183
-
184
-
185
-
186
 |
 |

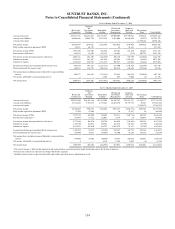
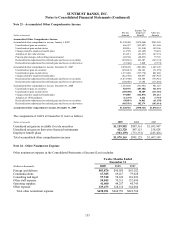
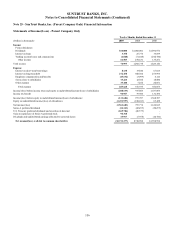
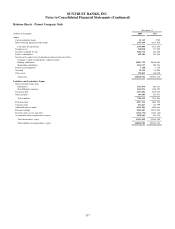
SUNTRUST BANKS, INC.
Notes to Consolidated Financial Statements (Continued)
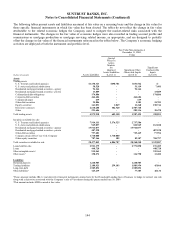
Fair Value Measurements
Using Significant Unobservable Inputs
(Dollars in thousands)
Trading
Assets
Securities
Available
for Sale
Loans
Held for
Sale Loans
Long-term
Debt
Beginning balance January 1, 2008 $2,950,145 $869,707 $481,327 $220,784 $-
Total gains/(losses) (realized/unrealized):
Included in earnings (401,347) 1, 5 (80,251) 2, 5 (60,114) 3(30,261) 4(52,600) 1
Included in other comprehensive income 249,547 6(20,708) - - -
Purchase accounting adjustments - - - 5,141 -
Purchases and issuances 414,936 193,054 - 112,153 -
Settlements (50,682) (70,643) - - -
Sales (1,628,149) (116,555) (34,049) - -
Repurchase of debt - - - - 151,966
Paydowns and maturities (852,052) (164,230) (216,861) (57,537) -
Transfers from loans held for sale to loans held in portfolio - - (83,894) 83,894 -
Loan foreclosures transferred to other real estate owned - - (5,884) (63,832) -
Level 3 transfers, net 708,987 879,230 406,920 - (3,595,627)
Ending balance December 31, 2008 $1,391,385 $1,489,604 $487,445 $270,342 ($3,496,261)
The amount of total losses for the year ended December 31, 2008 included in
earnings attributable to the change in unrealized gains/(losses) relating to
instruments still held at December 31, 2008 ($208,377) 1($45,098) 2($70,975) 3($26,804) 4($52,699) 1
1Amounts included in earnings are recorded in trading account profits and commissions.
2Amounts included in earnings are recorded in net securities gains/(losses).
3Amounts included in earnings are recorded in mortgage production related income.
4Amounts are generally included in mortgage production income except $4.2 million in the year ended December 31, 2008, related to loans acquired in the GB&T acquisition. The
mark on the loans is included in trading account profits and commissions.
5Amounts included in earnings do not include losses accrued as a result of the ARS settlement discussed in Note 21 “Contingencies,” to the Consolidated Financial Statements.
6Amount recorded in other comprehensive income is the effective portion of the Cash Flow hedges related to the Company’s probable forecasted sale of its shares of the Coca-Cola
Company stock as discussed in Note 17 “Derivative Financial Instruments,” to the Consolidated Financial Statements.
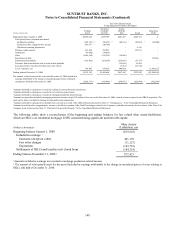
The following tables show a reconciliation of the beginning and ending balances for fair valued other assets/(liabilities),
which are IRLCs on residential mortgage LHFS, measured using significant unobservable inputs:
(Dollars in thousands)
Other Assets/
(Liabilities), net
Beginning balance January 1, 2008 ($19,603)
Included in earnings: 1
Issuances (inception value) 491,170
Fair value changes (71,127)
Expirations (143,701)
Settlements of IRLCs and transfers into closed loans (184,318)
Ending balance December 31, 2008 2$72,421
1Amounts included in earnings are recorded in mortgage production related income.
2The amount of total gains/(losses) for the period included in earnings attributable to the change in unrealized gains or losses relating to
IRLCs still held at December 31, 2008.
148