SunTrust 2009 Annual Report Download - page 134
Download and view the complete annual report
Please find page 134 of the 2009 SunTrust annual report below. You can navigate through the pages in the report by either clicking on the pages listed below, or by using the keyword search tool below to find specific information within the annual report.-
 1
1 -
2
-
3
-
4
-
5
-
6
-
7
-
8
-
9
-
10
-
11
-
12
-
13
-
14
-
15
-
16
-
17
-
18
-
19
-
20
-
21
-
22
-
23
-
24
-
25
-
26
-
27
-
28
-
29
-
30
-
31
-
32
-
33
-
34
-
35
-
36
-
37
-
38
-
39
-
40
-
41
-
42
-
43
-
44
-
45
-
46
-
47
-
48
-
49
-
50
-
51
-
52
-
53
-
54
-
55
-
56
-
57
-
58
-
59
-
60
-
61
-
62
-
63
-
64
-
65
-
66
-
67
-
68
-
69
-
70
-
71
-
72
-
73
-
74
-
75
-
76
-
77
-
78
-
79
-
80
-
81
-
82
-
83
-
84
-
85
-
86
-
87
-
88
-
89
-
90
-
91
-
92
-
93
-
94
-
95
-
96
-
97
-
98
-
99
-
100
-
101
-
102
-
103
-
104
-
105
-
106
-
107
-
108
-
109
-
110
-
111
-
112
-
113
-
114
-
115
-
116
-
117
-
118
-
119
-
120
-
121
-
122
-
123
-
 124
124 -
 125
125 -
 126
126 -
 127
127 -
 128
128 -
 129
129 -
 130
130 -
 131
131 -
 132
132 -
 133
133 -
 134
134 -
 135
135 -
 136
136 -
 137
137 -
 138
138 -
 139
139 -
 140
140 -
 141
141 -
 142
142 -
 143
143 -
 144
144 -
145
-
146
-
147
-
148
-
149
-
150
-
151
-
152
-
153
-
154
-
155
-
156
-
157
-
158
-
159
-
160
-
161
-
162
-
163
-
164
-
165
-
166
-
167
-
168
-
169
-
170
-
171
-
172
-
173
-
174
-
175
-
176
-
177
-
178
-
179
-
180
-
181
-
182
-
183
-
184
-
185
-
186
 |
 |

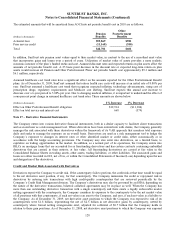
SUNTRUST BANKS, INC.
Notes to Consolidated Financial Statements (Continued)
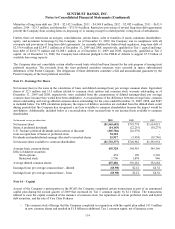
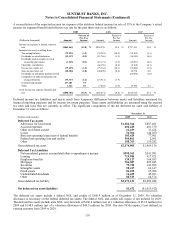
A reconciliation of the expected income tax expense at the statutory federal income tax rate of 35% to the Company’s actual
income tax expense/(benefit) and effective tax rate for the past three years is as follows:
2009 2008 2007
(Dollars in thousands) Amount
Percent of
Pre-Tax
Income Amount
Percent of
Pre-Tax
Income Amount
Percent of
Pre-Tax
Income
Income tax expense at federal statutory
rate ($861,863) (35.0) % $254,976 35.0 % $787,335 35.0 %
Increase (decrease) resulting from:
Tax-exempt interest (79,293) (3.2) (74,921) (10.2) (74,183) (3.3)
Dividends received deduction (12,117) (0.5) (13,766) (1.9) (14,949) (0.6)
Dividends paid on employee stock
ownership plan shares (1,165) (0.1) (13,173) (1.9) (13,437) (0.6)
Charitable contribution --(64,196) (8.8) (2,168) (0.1)
Income tax credits, net (79,425) (3.2) (75,164) (10.3) (75,480) (3.4)
State income taxes, net (48,306) (2.0) (60,098) (8.2) 18,578 0.8
Dividends on subsidiary preferred stock -- - - (23,884) (1.0)
Completion of audit examinations by
taxing authorities (55,337) (2.2) (13,911) (1.9) - -
Goodwill impairment 237,101 9.6 -- --
Other 1,622 0.1 (7,018) (1.0) 13,702 0.6
Total income tax expense (benefit) and
rate ($898,783) (36.5) % ($67,271) (9.2) % $615,514 27.4 %
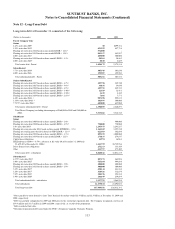
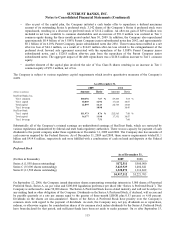
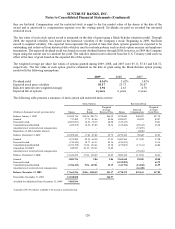
Deferred income tax liabilities and assets result from temporary differences between assets and liabilities measured for
financial reporting purposes and for income tax return purposes. These assets and liabilities are measured using the enacted
tax rates and laws that are currently in effect. The significant components of the net deferred tax asset and liability at
December 31 were as follows:
December 31,
(Dollars in thousands) 2009 2008
Deferred Tax Assets
Allowance for loan losses $1,181,364 $887,401
Accrued expenses 402,425 401,370
Other real estate owned 61,659 33,428
Loans 36,304 (44,207)
State net operating losses (net of federal benefit) 103,429 77,901
Federal net operating loss and credits 500,861 2,961
Other 188,763 110,282
Gross deferred tax asset $2,474,805 $1,469,136
Deferred Tax Liabilities
Net unrealized gains in accumulated other comprehensive income $590,363 $541,981
Leasing 719,984 917,921
Employee benefits 139,127 164,053
Mortgage 706,087 485,045
Securities 75,722 143,096
Intangible assets 50,417 62,617
Fixed assets 86,255 67,908
Undistributed dividends 16,659 42,053
Other 88,519 64,374
Gross deferred tax liability $2,473,133 $2,489,048
Net deferred tax asset/(liability) $1,672 ($1,019,912)
The deferred tax assets include a federal NOL and credits of $500.9 million as of December 31, 2009. No valuation
allowance is necessary on the federal deferred tax assets. The federal NOL and credits will expire, if not utilized, by 2029.
The deferred tax assets include state NOL carryforwards of $186.0 million (net of a valuation allowance of $53.2 million) for
2009 and $148.5 million (net of a valuation allowance of $40.5 million) for 2008. The state NOLs expire, if not utilized, in
varying amounts from 2009 to 2029.
118