SunTrust 2009 Annual Report Download - page 161
Download and view the complete annual report
Please find page 161 of the 2009 SunTrust annual report below. You can navigate through the pages in the report by either clicking on the pages listed below, or by using the keyword search tool below to find specific information within the annual report.-
 1
1 -
2
-
3
-
4
-
5
-
6
-
7
-
8
-
9
-
10
-
11
-
12
-
13
-
14
-
15
-
16
-
17
-
18
-
19
-
20
-
21
-
22
-
23
-
24
-
25
-
26
-
27
-
28
-
29
-
30
-
31
-
32
-
33
-
34
-
35
-
36
-
37
-
38
-
39
-
40
-
41
-
42
-
43
-
44
-
45
-
46
-
47
-
48
-
49
-
50
-
51
-
52
-
53
-
54
-
55
-
56
-
57
-
58
-
59
-
60
-
61
-
62
-
63
-
64
-
65
-
66
-
67
-
68
-
69
-
70
-
71
-
72
-
73
-
74
-
75
-
76
-
77
-
78
-
79
-
80
-
81
-
82
-
83
-
84
-
85
-
86
-
87
-
88
-
89
-
90
-
91
-
92
-
93
-
94
-
95
-
96
-
97
-
98
-
99
-
100
-
101
-
102
-
103
-
104
-
105
-
106
-
107
-
108
-
109
-
110
-
111
-
112
-
113
-
114
-
115
-
116
-
117
-
118
-
119
-
120
-
121
-
122
-
123
-
124
-
125
-
126
-
127
-
128
-
129
-
130
-
131
-
132
-
133
-
134
-
135
-
136
-
137
-
138
-
139
-
140
-
141
-
142
-
143
-
144
-
145
-
146
-
147
-
148
-
149
-
150
-
 151
151 -
 152
152 -
 153
153 -
 154
154 -
 155
155 -
 156
156 -
 157
157 -
 158
158 -
 159
159 -
 160
160 -
 161
161 -
 162
162 -
 163
163 -
 164
164 -
 165
165 -
 166
166 -
 167
167 -
 168
168 -
 169
169 -
 170
170 -
 171
171 -
172
-
173
-
174
-
175
-
176
-
177
-
178
-
179
-
180
-
181
-
182
-
183
-
184
-
185
-
186
 |
 |

SUNTRUST BANKS, INC.
Notes to Consolidated Financial Statements (Continued)
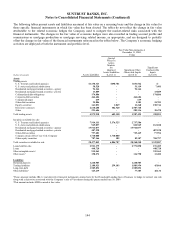
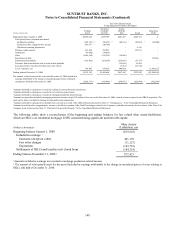
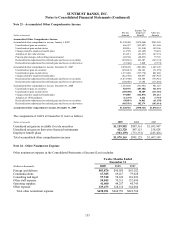
Fair Value Gain/(Loss) for the Year Ended December 31,
2009, for Items Measured at Fair Value Pursuant to Election of the Fair Value Option
(Dollars in thousands)
Trading Account
Profits/(losses) and
Commissions
Mortgage
Production
Related
Income 2
Mortgage
Servicing
Related Income
Total
Changes in
Fair Values
Included in
Current-
Period
Earnings1
Assets
Trading assets $3,165 $- $ - $3,165
Loans held for sale 2,020 625,396 - 627,416
Loans 2,353 (666) - 1,687
Other intangible assets - 17,551 65,944 83,495
Liabilities
Brokered deposits 11,249 - - 11,249
Long-term debt (64,826) - - (64,826)
1Changes in fair value for the year ended December 31, 2009, exclude accrued interest for the periods then ended. Interest income or interest expense on trading assets,
loans, loans held for sale, brokered deposits and long-term debt that have been elected to be carried at fair value are recorded in interest income or interest expense in the
Consolidated Statements of Income/(Loss) based on their contractual coupons. Certain trading assets do not have a contractually stated coupon and, for these securities,
the Company records interest income based on the effective yield calculated upon acquisition of those securities.
2For the year ended December 31, 2009, income related to loans held for sale, includes $664.3 million related to MSRs recognized upon the sale of loans reported at fair
value. For the year ended December 31, 2009, income related to other intangible assets includes $17.5 million of MSRs recognized upon the sale of loans reported at the
lower of cost or market value. These MSRs are included in the table since the Company elected to report MSRs recognized in 2009 using the fair value method.
Previously, MSRs were reported under the amortized cost method.
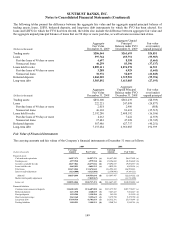
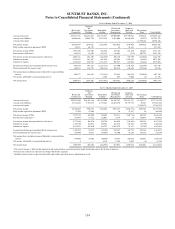
Fair Value Measurements at
December 31, 2008,
Using
(Dollars in thousands) Assets/Liabilities
Quoted
Prices In
Active
Markets
for
Identical
Assets/Liabilities
(Level 1)
Significant
Other
Observable
Inputs
(Level 2)
Significant
Unobservable
Inputs
(Level 3)
Assets
Trading assets
U.S. Treasury and federal agencies $3,127,635 $142,906 $2,339,469 $645,260
U.S. states and political subdivisions 159,135 - 151,809 7,326
Corporate debt securities 585,809 - 579,159 6,650
Commercial paper 399,611 - 399,611 -
Residential mortgage-backed securities - agencies 58,565 - 58,565 -
Residential mortgage-backed securities - private 37,970 - - 37,970
Collateralized debt obligations 261,528 - - 261,528
Other debt securities 813,176 - 790,231 22,945
Equity securities 116,788 6,415 8,409 101,964
Derivative contracts 4,701,783 - 4,452,236 249,547
Other 134,269 - 76,074 58,195
Total trading assets 10,396,269 149,321 8,855,563 1,391,385
Securities available for sale
U.S. Treasury and federal agencies 486,153 127,123 359,030 -
U.S. states and political subdivisions 1,037,429 - 958,167 79,262
Residential mortgage-backed securities - agencies 14,550,104 - 14,550,104 -
Residential mortgage-backed securities - private 522,151 - - 522,151
Other debt securities 294,185 - 265,772 28,413
Common stock of The Coca-Cola Company 1,358,100 1,358,100 - -
Other equity securities 1,448,415 141 588,495 859,779
Total securities available for sale 19,696,537 1,485,364 16,721,568 1,489,605
Loans held for sale 2,424,432 - 1,936,987 487,445
Loans 270,342 - - 270,342
Other assets 1109,600 775 35,231 73,594
Liabilities
Brokered deposits 587,486 - 587,486 -
Trading liabilities 3,240,784 440,436 2,800,348 -
Other short-term borrowings 399,611 - 399,611 -
Long-term debt 7,155,684 - 3,659,423 3,496,261
Other liabilities 172,911 - 71,738 1,173
1This amount includes IRLCs and derivative financial instruments entered into by the Household Lending line of business to hedge its interest rate risk.
145