SunTrust 2009 Annual Report Download - page 87
Download and view the complete annual report
Please find page 87 of the 2009 SunTrust annual report below. You can navigate through the pages in the report by either clicking on the pages listed below, or by using the keyword search tool below to find specific information within the annual report.-
 1
1 -
2
-
3
-
4
-
5
-
6
-
7
-
8
-
9
-
10
-
11
-
12
-
13
-
14
-
15
-
16
-
17
-
18
-
19
-
20
-
21
-
22
-
23
-
24
-
25
-
26
-
27
-
28
-
29
-
30
-
31
-
32
-
33
-
34
-
35
-
36
-
37
-
38
-
39
-
40
-
41
-
42
-
43
-
44
-
45
-
46
-
47
-
48
-
49
-
50
-
51
-
52
-
53
-
54
-
55
-
56
-
57
-
58
-
59
-
60
-
61
-
62
-
63
-
64
-
65
-
66
-
67
-
68
-
69
-
70
-
71
-
72
-
73
-
74
-
75
-
76
-
 77
77 -
 78
78 -
 79
79 -
 80
80 -
 81
81 -
 82
82 -
 83
83 -
 84
84 -
 85
85 -
 86
86 -
 87
87 -
 88
88 -
 89
89 -
 90
90 -
 91
91 -
 92
92 -
 93
93 -
 94
94 -
 95
95 -
 96
96 -
 97
97 -
98
-
99
-
100
-
101
-
102
-
103
-
104
-
105
-
106
-
107
-
108
-
109
-
110
-
111
-
112
-
113
-
114
-
115
-
116
-
117
-
118
-
119
-
120
-
121
-
122
-
123
-
124
-
125
-
126
-
127
-
128
-
129
-
130
-
131
-
132
-
133
-
134
-
135
-
136
-
137
-
138
-
139
-
140
-
141
-
142
-
143
-
144
-
145
-
146
-
147
-
148
-
149
-
150
-
151
-
152
-
153
-
154
-
155
-
156
-
157
-
158
-
159
-
160
-
161
-
162
-
163
-
164
-
165
-
166
-
167
-
168
-
169
-
170
-
171
-
172
-
173
-
174
-
175
-
176
-
177
-
178
-
179
-
180
-
181
-
182
-
183
-
184
-
185
-
186
 |
 |

Provision for credit losses was $1.7 billion, an increase of $790.3 million, or 88.5%, principally due to higher consumer
mortgage and home equity line charge-offs.
Total noninterest income was $727.7 million, a $246.4 million, or 51.2%, increase driven by higher mortgage production and
servicing income. Total mortgage production income increased $190.2 million, or 105.4%, principally due to income from
higher loan production volume at improved margins partially offset by higher reserves for repurchased loans. Total mortgage
loan production for the year ended December 31, 2009 was $50.1 billion, up 37.6% from $36.4 billion the prior year. Total
servicing income increased $519.6 million primarily due to a $199.2 million recovery in 2009 on MSRs carried at the
LOCOM compared to a $370.0 million impairment charge in 2008. The 2008 MSR impairment was offset by net securities
gains of $410.7 million in the fourth quarter of 2008 from the sale of available for sale securities that were held in
conjunction with our risk management strategies associated with economically hedging the value of MSRs. At December 31,
2009 total mortgage loans serviced were $178.9 billion, up $16.9 billion, or 10.4%, from $162.0 billion at December 31,
2008.
Total noninterest expense was $1.8 billion, an increase of $254.1 million, or 16.6%. The increase was primarily due to a
$451.9 million non-cash goodwill impairment charge recorded in first quarter of 2009. Credit-related expense including other
real estate, credit service, and collection costs also increased $125.4 million, or 61.0%. The increases were partially offset by
a $373.7 million decrease in operating losses primarily due to a change in classification related to borrower misrepresentation
and claim denials. Beginning in 2009, these losses were recorded as charge-offs against the allowance for loan losses and
were included in the overall allowance for loan losses. Additionally, personnel expense was up $115.8 million principally
due to higher commission expense resulting from higher loan production.
Wealth and Investment Management
Wealth and Investment Management’s net income for the twelve months ended December 31, 2009 was $67.9 million, a
decrease of $106.5 million compared to the same period in 2008. The decrease in net income was primarily due to the gains
from the sales of First Mercantile and Lighthouse Investment Partners in 2008 and the resulting reduction in noninterest
income partially offset by lower noninterest expense in 2009. Net income in 2008 included a $63.8 million market valuation
loss on an acquired security primarily in the third quarter and a $45.0 million impairment charge on a client-based intangible
asset in the second quarter.
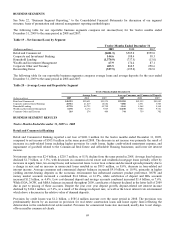
Net interest income was $304.0 million, a decrease of $21.1 million, or 6.5%, as higher average loan and deposit balances
were more than offset by spread compression. Average loans increased slightly while net interest income on loans declined
$6.3 million, or 4.6%, due to compressed spreads. Average deposits increased $1.5 billion, or 16.0%, while deposit-related
net interest income decreased $13.3 million, or 6.6%, due to a change in mix, a decrease in the relative value of demand
deposits, and spread compression in NOW and money market accounts.
Provision for credit losses were $79.2 million, an increase of $52.3 million primarily due to higher consumer and commercial
loan net charge-offs.
Total noninterest income was $748.6 million, a $200.6 million, or 21.1%, decrease primarily due to an $89.4 million gain on
sale of a minority interest in Lighthouse Investment Partners in the first quarter of 2008, $50.1 million net decline due to the
sale of First Mercantile in the second quarter of 2008, and lower trust income and retail investment income. Trust income
decreased $102.9 million, or 17.5%, primarily due to lower market valuations on managed equity assets, investment advisory
fee waivers on managed liquidity funds, migration of money market fund assets into deposits, and the sale of First
Mercantile. Retail investment income declined $71.3 million, or 25.5%, due to lower annuity sales and market driven
declines in assets in managed accounts. Partially offsetting those declines, trading gains and losses increased $78.4 million
primarily due to a $63.8 million market valuation loss on a security purchased from our RidgeWorth subsidiary recorded in
the third quarter of 2008.
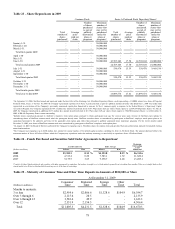
As of December 31, 2009, assets under management were approximately $119.5 billion compared to $113.1 billion as of
December 31, 2008. Assets under management include individually managed assets, the RidgeWorth Funds, managed
institutional assets, and participant-directed retirement accounts. SunTrust’s total assets under advisement were
approximately $205.4 billion, which includes $119.5 billion in assets under management, $46.0 billion in non-managed trust
assets, $31.8 billion in retail brokerage assets, and $8.1 billion in non-managed corporate trust assets.
Total noninterest expense was $863.1 million, down $106.8 million, or 11.0%, primarily due to the sale of First Mercantile in
2008 and a $45.0 million impairment charge on a client based intangible incurred in the second quarter of 2008. Employee
compensation declined $63.2 million, or 13.4%, resulting from reduced headcount and lower incentive payments.
Discretionary expenses including other staff, advertising, and customer development declined $12.3 million, or 36.4%. Other
expense also declined $21.6 million primarily due to the sale of First Mercantile and reduced clearing costs related to retail
investment income. These decreases were partially offset by higher operating losses, other real estate expense, indirect
support cost, and FDIC expense.
71