SunTrust 2009 Annual Report Download - page 137
Download and view the complete annual report
Please find page 137 of the 2009 SunTrust annual report below. You can navigate through the pages in the report by either clicking on the pages listed below, or by using the keyword search tool below to find specific information within the annual report.-
 1
1 -
2
-
3
-
4
-
5
-
6
-
7
-
8
-
9
-
10
-
11
-
12
-
13
-
14
-
15
-
16
-
17
-
18
-
19
-
20
-
21
-
22
-
23
-
24
-
25
-
26
-
27
-
28
-
29
-
30
-
31
-
32
-
33
-
34
-
35
-
36
-
37
-
38
-
39
-
40
-
41
-
42
-
43
-
44
-
45
-
46
-
47
-
48
-
49
-
50
-
51
-
52
-
53
-
54
-
55
-
56
-
57
-
58
-
59
-
60
-
61
-
62
-
63
-
64
-
65
-
66
-
67
-
68
-
69
-
70
-
71
-
72
-
73
-
74
-
75
-
76
-
77
-
78
-
79
-
80
-
81
-
82
-
83
-
84
-
85
-
86
-
87
-
88
-
89
-
90
-
91
-
92
-
93
-
94
-
95
-
96
-
97
-
98
-
99
-
100
-
101
-
102
-
103
-
104
-
105
-
106
-
107
-
108
-
109
-
110
-
111
-
112
-
113
-
114
-
115
-
116
-
117
-
118
-
119
-
120
-
121
-
122
-
123
-
124
-
125
-
126
-
 127
127 -
 128
128 -
 129
129 -
 130
130 -
 131
131 -
 132
132 -
 133
133 -
 134
134 -
 135
135 -
 136
136 -
 137
137 -
 138
138 -
 139
139 -
 140
140 -
 141
141 -
 142
142 -
 143
143 -
 144
144 -
 145
145 -
 146
146 -
 147
147 -
148
-
149
-
150
-
151
-
152
-
153
-
154
-
155
-
156
-
157
-
158
-
159
-
160
-
161
-
162
-
163
-
164
-
165
-
166
-
167
-
168
-
169
-
170
-
171
-
172
-
173
-
174
-
175
-
176
-
177
-
178
-
179
-
180
-
181
-
182
-
183
-
184
-
185
-
186
 |
 |

SUNTRUST BANKS, INC.
Notes to Consolidated Financial Statements (Continued)
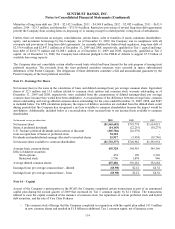
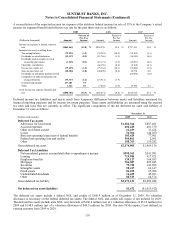
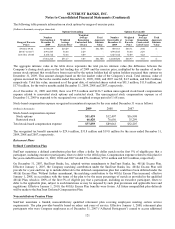
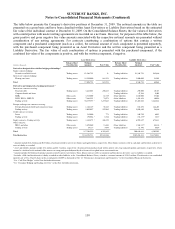
The following table presents information on stock options by ranges of exercise price:
(Dollars in thousands, except per share data)
Options Outstanding Options Exercisable
Range of Exercise
Prices
Number
Outstanding at
December 31,
2009
Weighted
Average
Exercise Price
Weighted
Average
Remaining
Contractual Life
(Years)
Total
Aggregate
Intrinsic
Value
Number
Exercisable at
December 31,
2009
Weighted
Average
Exercise
Price
Weighted
Average
Remaining
Contractual
Life (Years)
Total
Aggregate
Intrinsic
Value
$9.06 to 49.46 4,510,659 $14.29 8.38 $41,788 489,563 $44.71 2.40 $-
$49.47 to 64.57 4,991,845 56.44 2.29 - 4,991,845 56.44 2.29 -
$64.58 to 150.45 8,158,712 72.66 4.89 - 6,627,412 72.89 4.22 -
17,661,216 $53.17 5.05 $41,788 12,108,820 $64.97 3.35 $-
The aggregate intrinsic value in the table above represents the total pre-tax intrinsic value (the difference between the
Company’s closing stock price on the last trading day of 2009 and the exercise price, multiplied by the number of in-the-
money stock options) that would have been received by the option holders had all option holders exercised their options on
December 31, 2009. This amount changes based on the fair market value of the Company’s stock. Total intrinsic value of
options exercised for the twelve months ended December 31, 2009, 2008, and 2007 was $0, $4.5 million, and $68.2 million,
respectively. Total fair value, measured as of the grant date, of restricted shares vested was $81.3 million, $11.8 million, and
$17.0 million, for the twelve months ended December 31, 2009, 2008 and 2007, respectively.
As of December 31, 2009 and 2008, there was $77.8 million and $126.7 million unrecognized stock-based compensation
expense related to nonvested stock options and restricted stock. The unrecognized stock compensation expense as of
December 31, 2009 is expected to be recognized over a weighted average period of 1.68 years.
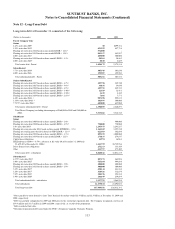
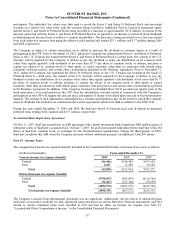
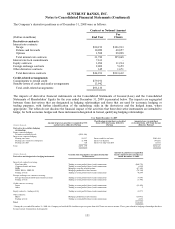
Stock-based compensation expense recognized in noninterest expense for the year ended December 31 was as follows:
(Dollars in thousands) 2009 2008 2007
Stock-based compensation expense:
Stock options $11,439 $12,407 $16,908
Restricted stock 66,420 76,656 35,299
Total stock-based compensation expense $77,859 $89,063 $52,207
The recognized tax benefit amounted to $29.6 million, $33.8 million and $19.8 million for the years ended December 31,
2009, 2008 and 2007, respectively.
Retirement Plans
Defined Contribution Plan
SunTrust maintains a defined contribution plan that offers a dollar for dollar match on the first 5% of eligible pay that a
participant, including executive participants, elects to defer to the 401(k) plan. Compensation expense related to this plan for
the years ended December 31, 2009, 2008 and 2007 totaled $76.4 million, $79.6 million and $69.6 million, respectively.
On December 31, 2007, SunTrust Banks, Inc. adopted written amendments to SunTrust Banks, Inc. 401(k) Excess Plan.
Effective January 1, 2007, the Company matching contribution under the SunTrust Banks, Inc. 401(k) Excess Plan will
provide for a year-end true up to include deferrals to the deferred compensation plan that could have been deferred under the
401(k) Excess Plan. Without further amendment, the matching contribution to the 401(k) Excess Plan increased, effective
January 1, 2008, in accordance with the terms of the plan to be the same percentage of match as provided in the qualified
401(k) Plan, which is 100% of the first 5% of eligible pay that a participant, including an executive participant, elects to
defer to the applicable plan, subject to such limitations as may be imposed by such plan provisions and applicable laws and
regulations. Effective January 1, 2010, the 401(k) Excess Plan benefits were frozen. All future nonqualified plan deferrals
will be made to the SunTrust Deferred Compensation Plan.
Noncontributory Pension Plans
SunTrust maintains a funded, noncontributory qualified retirement plan covering employees meeting certain service
requirements. The plan provides benefits based on salary and years of service. Effective January 1, 2008, retirement plan
participants who were Company employees as of December 31, 2007 (“Affected Participants”) ceased to accrue additional
121