SunTrust 2009 Annual Report Download - page 83
Download and view the complete annual report
Please find page 83 of the 2009 SunTrust annual report below. You can navigate through the pages in the report by either clicking on the pages listed below, or by using the keyword search tool below to find specific information within the annual report.-
 1
1 -
2
-
3
-
4
-
5
-
6
-
7
-
8
-
9
-
10
-
11
-
12
-
13
-
14
-
15
-
16
-
17
-
18
-
19
-
20
-
21
-
22
-
23
-
24
-
25
-
26
-
27
-
28
-
29
-
30
-
31
-
32
-
33
-
34
-
35
-
36
-
37
-
38
-
39
-
40
-
41
-
42
-
43
-
44
-
45
-
46
-
47
-
48
-
49
-
50
-
51
-
52
-
53
-
54
-
55
-
56
-
57
-
58
-
59
-
60
-
61
-
62
-
63
-
64
-
65
-
66
-
67
-
68
-
69
-
70
-
71
-
72
-
 73
73 -
 74
74 -
 75
75 -
 76
76 -
 77
77 -
 78
78 -
 79
79 -
 80
80 -
 81
81 -
 82
82 -
 83
83 -
 84
84 -
 85
85 -
 86
86 -
 87
87 -
 88
88 -
 89
89 -
 90
90 -
 91
91 -
 92
92 -
 93
93 -
94
-
95
-
96
-
97
-
98
-
99
-
100
-
101
-
102
-
103
-
104
-
105
-
106
-
107
-
108
-
109
-
110
-
111
-
112
-
113
-
114
-
115
-
116
-
117
-
118
-
119
-
120
-
121
-
122
-
123
-
124
-
125
-
126
-
127
-
128
-
129
-
130
-
131
-
132
-
133
-
134
-
135
-
136
-
137
-
138
-
139
-
140
-
141
-
142
-
143
-
144
-
145
-
146
-
147
-
148
-
149
-
150
-
151
-
152
-
153
-
154
-
155
-
156
-
157
-
158
-
159
-
160
-
161
-
162
-
163
-
164
-
165
-
166
-
167
-
168
-
169
-
170
-
171
-
172
-
173
-
174
-
175
-
176
-
177
-
178
-
179
-
180
-
181
-
182
-
183
-
184
-
185
-
186
 |
 |

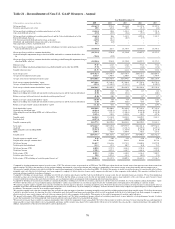
Table 18 – Selected Quarterly Financial Data
Three Months Ended
2009 2008
(Dollars in millions, except per share and other data) December 31 September 30 June 30 March 31 December 31 September 30 June 30 March 31
Summary of Operations
Interest income $1,629.6 $1,657.5 $1,693.3 $1,729.3 $1,985.4 $2,017.3 $2,066.4 $2,258.3
Interest expense 453.1 520.0 603.6 667.2 808.5 871.1 909.7 1,118.5
Net interest income 1,176.5 1,137.5 1,089.7 1,062.1 1,176.9 1,146.2 1,156.7 1,139.8
Provision for credit losses 4973.7 1,133.9 962.2 994.1 962.5 503.7 448.0 560.0
Net interest income after provision for credit losses 202.8 3.6 127.5 68.0 214.4 642.5 708.7 579.8
Noninterest income 1742.3 775.0 1,071.7 1,121.2 717.7 1,285.2 1,413.0 1,057.5
Noninterest expense 1,453.6 1,428.9 1,528.0 2,152.0 1,586.2 1,665.3 1,375.3 1,252.2
Income/(loss) before provision/(benefit) for income taxes (508.5) (650.3) (328.8) (962.8) (654.1) 262.4 746.4 385.1
Net income attributable to noncontrolling interest 2.6 2.7 3.6 3.2 2.5 2.8 3.2 2.9
Provision/(benefit) for income taxes (263.0) (336.1) (148.9) (150.8) (309.0) (52.8) 202.8 91.6
Net income/(loss) (248.1) (316.9) (183.5) (815.2) (347.6) 312.4 540.4 290.6
Net income/(loss) available to common shareholders ($316.4) ($377.1) ($164.4) ($875.4) ($374.9) $304.4 $530.0 $281.6
Net interest income-FTE 2$1,206.8 $1,168.2 $1,121.1 $1,093.0 $1,208.7 $1,175.7 $1,185.0 $1,167.8
Total revenue-FTE 21,949.1 1,943.2 2,192.8 2,214.2 1,926.4 2,460.9 2,598.0 2,225.3
Total revenue-FTE excluding net securities gains/(losses), net 21,876.2 1,896.5 2,217.7 2,210.8 1,515.3 2,287.9 2,048.2 2,285.9
Net income/(loss) per average common share: 3
Diluted ($0.64) ($0.76) ($0.41) ($2.49) ($1.07) $0.87 $1.52 $0.81
Diluted excluding goodwill/intangible impairment charges
other than MSRs 2(0.64) (0.76) (0.41) (0.46) (1.07) 0.87 1.59 0.81
Basic (0.64) (0.76) (0.41) (2.49) (1.07) 0.87 1.52 0.81
Dividends paid per average common share 0.01 0.01 0.10 0.10 0.54 0.77 0.77 0.77
Book value per common share 35.29 36.06 36.16 46.03 48.74 49.64 49.56 51.59
Tangible book value per common share 222.59 23.35 23.41 28.15 28.69 29.18 29.04 31.13
Market capitalization $10,128 $11,256 $8,205 $4,188 $10,472 $15,925 $12,805 $19,290
Market Price:
High 24.09 24.43 20.86 30.18 57.75 64.00 60.80 70.00
Low 18.45 14.50 10.50 6.00 19.75 25.60 32.34 52.94
Close 20.29 22.55 16.45 11.74 29.54 44.99 36.22 55.14
Selected Average Balances
Total assets $174,040.5 $172,463.2 $176,480.5 $178,871.3 $177,047.3 $173,888.5 $175,548.8 $176,916.9
Earning assets 146,587.2 149,579.4 153,177.2 154,390.0 153,187.9 152,319.8 152,483.0 153,003.6
Loans 115,036.1 119,796.2 124,123.4 125,333.5 127,607.9 125,642.0 125,191.9 123,263.0
Consumer and commercial deposits 117,008.5 114,486.4 113,527.5 107,514.9 102,238.4 100,199.8 101,727.0 101,168.4
Brokered and foreign deposits 5,145.0 5,192.9 6,608.4 7,417.3 12,648.7 15,799.8 15,068.3 15,468.6
Total shareholders’ equity 22,380.7 22,467.9 21,925.7 22,367.9 19,891.0 18,097.4 18,209.3 18,178.7
Average common shares outstanding (000s)
Diluted 494,332 494,169 399,242 351,352 350,439 350,970 349,783 348,072
Basic 494,332 494,169 399,242 351,352 350,439 349,916 348,714 346,581
Financial Ratios and Other Data (Annualized)
Return on average total assets (0.57) % (0.73) % (0.42) % (1.85) % (0.78) % 0.71 % 1.24 % 0.66 %
Return on average assets less net unrealized securities gains/
(losses) 2(0.70) (0.83) (0.41) (1.89) (1.39) 0.45 0.42 0.72
Return on average common shareholders equity (7.19) (8.52) (3.95) (20.71) (8.47) 6.88 12.04 6.41
Return on average realized common shareholders’ equity 2(8.81) (9.70) (4.02) (22.08) (15.33) 4.45 4.32 7.58
Net interest margin- FTE 3.27 3.10 2.94 2.87 3.14 3.07 3.13 3.07
Efficiency ratio- FTE 74.58 73.53 69.68 97.22 82.34 67.67 52.94 56.27
Tangible efficiency ratio 273.96 72.82 69.05 62.97 81.44 66.92 50.45 55.34
Total average shareholders’ equity to average assets 12.86 13.03 12.42 12.51 11.23 10.41 10.37 10.28
Tangible equity to tangible assets 29.66 9.96 9.75 8.85 8.46 6.47 6.34 6.63
Effective tax rate (benefit) (51.46) (51.46) (44.81) (15.61) (47.06) (20.32) 27.29 23.98
Allowance to period-end loans 2.76 2.61 2.37 2.21 1.86 1.54 1.46 1.25
Nonperforming assets to total loans plus OREO and other
repossessed assets 5.33 5.20 4.99 4.21 3.49 2.90 2.32 1.85
Common dividend payout ratio5N/A N/A N/A N/A N/A 89.4 51.3 95.5
Capital Adequacy
Tier 1 common equity 7.67 % 7.49 % 7.34 % 5.83 % 5.83 % 6.02 % 5.41 % 5.18 %
Tier 1 capital 12.96 12.58 12.23 11.02 10.87 8.15 7.47 7.23
Total capital 16.43 15.92 15.31 14.15 14.04 11.16 10.85 10.97
Tier 1 leverage 10.90 11.08 11.02 10.14 10.45 7.98 7.54 7.22
1Includes net securities gains/(losses) $72.8 $46.7 ($24.9) $3.4 $411.1 $173.0 $549.8 ($60.6)
2See Non-GAAP reconcilements in Table 22 of the MD&A.
3Prior period amounts have been recalculated in accordance with updated accounting guidance related to earnings per share, that was effective January 1, 2009 and required retrospective application .
4Beginning in the fourth quarter of 2009, SunTrust began recording the provision for unfunded commitments within the provision for credit losses in the Consolidated Statements of Income/(Loss). The
provision for unfunded commitments for the fourth quarter of 2009 was $57.2 million. Considering the immateriality of this provision, prior to the fourth quarter of 2009, the provision for unfunded
commitments remains classified within other noninterest expense in the Consolidated Statements of Income/(Loss).
5The common dividend payout ratio is not calculable in a period of net loss.
67