SunTrust 2009 Annual Report Download - page 44
Download and view the complete annual report
Please find page 44 of the 2009 SunTrust annual report below. You can navigate through the pages in the report by either clicking on the pages listed below, or by using the keyword search tool below to find specific information within the annual report.-
 1
1 -
2
-
3
-
4
-
5
-
6
-
7
-
8
-
9
-
10
-
11
-
12
-
13
-
14
-
15
-
16
-
17
-
18
-
19
-
20
-
21
-
22
-
23
-
24
-
25
-
26
-
27
-
28
-
29
-
30
-
31
-
32
-
33
-
 34
34 -
 35
35 -
 36
36 -
 37
37 -
 38
38 -
 39
39 -
 40
40 -
 41
41 -
 42
42 -
 43
43 -
 44
44 -
 45
45 -
 46
46 -
 47
47 -
 48
48 -
 49
49 -
 50
50 -
 51
51 -
 52
52 -
 53
53 -
 54
54 -
55
-
56
-
57
-
58
-
59
-
60
-
61
-
62
-
63
-
64
-
65
-
66
-
67
-
68
-
69
-
70
-
71
-
72
-
73
-
74
-
75
-
76
-
77
-
78
-
79
-
80
-
81
-
82
-
83
-
84
-
85
-
86
-
87
-
88
-
89
-
90
-
91
-
92
-
93
-
94
-
95
-
96
-
97
-
98
-
99
-
100
-
101
-
102
-
103
-
104
-
105
-
106
-
107
-
108
-
109
-
110
-
111
-
112
-
113
-
114
-
115
-
116
-
117
-
118
-
119
-
120
-
121
-
122
-
123
-
124
-
125
-
126
-
127
-
128
-
129
-
130
-
131
-
132
-
133
-
134
-
135
-
136
-
137
-
138
-
139
-
140
-
141
-
142
-
143
-
144
-
145
-
146
-
147
-
148
-
149
-
150
-
151
-
152
-
153
-
154
-
155
-
156
-
157
-
158
-
159
-
160
-
161
-
162
-
163
-
164
-
165
-
166
-
167
-
168
-
169
-
170
-
171
-
172
-
173
-
174
-
175
-
176
-
177
-
178
-
179
-
180
-
181
-
182
-
183
-
184
-
185
-
186
 |
 |

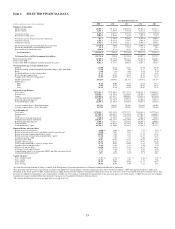
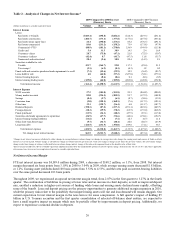
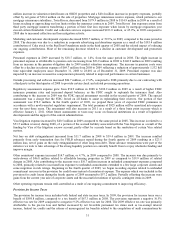
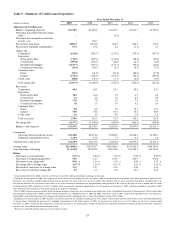
Table 3 - Noninterest Income
Year Ended December 31
(Dollars in millions) 2009 2008 2007
Service charges on deposit accounts $848.4 $904.1 $822.0
Other charges and fees 522.7 510.8 479.1
Trust and investment management income 486.5 592.3 685.0
Mortgage production related income 376.1 171.4 91.0
Mortgage servicing related income 329.9 (211.8) 195.4
Card fees 323.8 308.4 280.7
Investment banking income 272.0 236.5 214.9
Retail investment services 217.8 289.1 278.0
Trading account profits/(losses) and commissions (40.7) 38.2 (361.7)
Gain from ownership in Visa 112.1 86.3 -
Gain on sale of businesses -198.1 32.3
Net gain on sale/leaseback of premises -37.0 118.8
Other income 163.6 239.8 350.1
Net securities gains 98.0 1,073.3 243.1
Total noninterest income $3,710.2 $4,473.5 $3,428.7
Noninterest Income
Noninterest income decreased by $763.3 million, or 17.1%, in 2009, compared to 2008, driven largely by transactional items
in 2008 that did not recur in 2009 such as gains from the sale and contribution of Coke stock, gains from the sale of certain
businesses, and gains from the sale/leaseback of certain corporate real estate properties. In addition, mark to market valuation
losses on our public debt and related hedges carried at fair value were recognized in 2009 while mark to market valuation
gains were recognized in 2008. The decrease in noninterest income was partially offset by higher mortgage-related income as
a result of increased mortgage production in 2009 and an impairment charge recorded on our MSRs carried at LOCOM
during 2008 which was partially recovered in 2009. Additionally, in 2008, we recorded valuation losses related to our
expected purchase of ARS and mark to market write-downs related to illiquid securities and warehouse loans carried at
market that partially offset the overall decline in noninterest income.
Combined mortgage-related income increased $746.4 million compared to 2008. Mortgage servicing related income
increased $541.7 million compared to 2008, primarily due to a $199.2 million recovery of impairment on the MSRs carried
at LOCOM in 2009 compared to $370.0 million in impairment charges recorded during 2008 on our MSRs portfolio. This
increase was partially offset by higher amortization of MSRs due to an increase in prepayments, as well as a decline in the
fair value of MSRs.
Mortgage production related income increased $204.7 million, or 119.4%, compared to 2008, primarily due to a $13.7
billion, or 37.6%, increase in production volume that was partially offset by a $346.1 million increase in mortgage
repurchase related losses compared to 2008. The increase in production volume during 2009 was due in large part to
increased refinancing activity, which we do not expect to remain at this level in the near term. Mortgage repurchase related
losses increased from $98.2 million in 2008 to $444.3 million in 2009 as a result of increased repurchase requests from
government-sponsored agencies. As discussed in more detail in Note 18, “Reinsurance Arrangements and Guarantees,” to the
Consolidated Financial Statements, we provide standard representations and warranties when loans are sold to third party
investors. If it is later determined that such representations have been breached, the investor will request that we either
purchase the nonperforming loan or reimburse the investor for the loss incurred. Although mortgage repurchase reserves are
established at the time of sale, actual credit losses have exceeded the original estimates and we are recognizing higher losses.
We update our loss estimate by analyzing the population of loans sold by vintage and product in relation to our recent
experience and expected repurchase levels and as a result, the reserve for the repurchase of mortgage loans has increased. A
shift in the volume of repurchase requests occurred during the course of 2009 from loans originated and sold prior to 2007.
During the latter half of 2009, the majority of our repurchase requests pertained to loans originated and sold in 2007. We
believe ultimate losses on newer vintages, specifically 2008 and later, may be lower than older vintages. The elimination of
Alt-A loan products, tighter credit and underwriting guidelines, and enhanced processes have reduced the risk profile and,
therefore, the repurchase risk exposure of loans originated and sold since 2008. In addition, loans sold in recent years have
lower original loan-to-values and are subject to less home price depreciation which should reduce loss severities. While
mortgage repurchase related losses are expected to remain elevated during 2010, the shift towards loans originated and sold
28