SunTrust 2009 Annual Report Download - page 71
Download and view the complete annual report
Please find page 71 of the 2009 SunTrust annual report below. You can navigate through the pages in the report by either clicking on the pages listed below, or by using the keyword search tool below to find specific information within the annual report.-
 1
1 -
2
-
3
-
4
-
5
-
6
-
7
-
8
-
9
-
10
-
11
-
12
-
13
-
14
-
15
-
16
-
17
-
18
-
19
-
20
-
21
-
22
-
23
-
24
-
25
-
26
-
27
-
28
-
29
-
30
-
31
-
32
-
33
-
34
-
35
-
36
-
37
-
38
-
39
-
40
-
41
-
42
-
43
-
44
-
45
-
46
-
47
-
48
-
49
-
50
-
51
-
52
-
53
-
54
-
55
-
56
-
57
-
58
-
59
-
60
-
 61
61 -
 62
62 -
 63
63 -
 64
64 -
 65
65 -
 66
66 -
 67
67 -
 68
68 -
 69
69 -
 70
70 -
 71
71 -
 72
72 -
 73
73 -
 74
74 -
 75
75 -
 76
76 -
 77
77 -
 78
78 -
 79
79 -
 80
80 -
 81
81 -
82
-
83
-
84
-
85
-
86
-
87
-
88
-
89
-
90
-
91
-
92
-
93
-
94
-
95
-
96
-
97
-
98
-
99
-
100
-
101
-
102
-
103
-
104
-
105
-
106
-
107
-
108
-
109
-
110
-
111
-
112
-
113
-
114
-
115
-
116
-
117
-
118
-
119
-
120
-
121
-
122
-
123
-
124
-
125
-
126
-
127
-
128
-
129
-
130
-
131
-
132
-
133
-
134
-
135
-
136
-
137
-
138
-
139
-
140
-
141
-
142
-
143
-
144
-
145
-
146
-
147
-
148
-
149
-
150
-
151
-
152
-
153
-
154
-
155
-
156
-
157
-
158
-
159
-
160
-
161
-
162
-
163
-
164
-
165
-
166
-
167
-
168
-
169
-
170
-
171
-
172
-
173
-
174
-
175
-
176
-
177
-
178
-
179
-
180
-
181
-
182
-
183
-
184
-
185
-
186
 |
 |

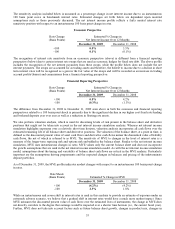
The sensitivity analysis included below is measured as a percentage change in net interest income due to an instantaneous
100 basis point move in benchmark interest rates. Estimated changes set forth below are dependent upon material
assumptions such as those previously discussed. The net interest income profile reflects a fairly neutral interest rate
sensitivity position with respect to an instantaneous 100 basis point change in rates.
Economic Perspective
Rate Change
(Basis Points)
Estimated % Change in
Net Interest Income Over 12 Months
December 31, 2009 December 31, 2008
+100 0.0% 3.5%
-100 0.1% (0.1%)
The recognition of interest rate sensitivity from an economic perspective (above) is different from a financial reporting
perspective (below) due to certain interest rate swaps that are used as economic hedges for fixed rate debt. The above profile
includes the recognition of the net interest payments from these swaps, while the profile below does not include the net
interest payments. The swaps are accounted for as trading assets and therefore, the benefit to income due to a decline in short
term interest rates will be recognized as a gain in the fair value of the swaps and will be recorded as an increase in trading
account profits/(losses) and commissions from a financial reporting perspective.
Financial Reporting Perspective
Rate Change
(Basis Points)
Estimated % Change in
Net Interest Income Over 12 Months
December 31, 2009 December 31, 2008
+100 0.5% 4.2%
-100 (0.3%) (1.3%)
The difference from December 31, 2008 to December 31, 2009 seen above in both the economic and financial reporting
perspectives related to a 100 basis point shock is primarily due to the significant decline in our higher cost fixed rate funding
and brokered deposits year over year as well as a reduction in floating rate assets.
We also perform valuation analysis, which is used for discerning levels of risk present in the balance sheet and derivative
positions that might not be taken into account in the net interest income simulation analysis. Whereas net interest income
simulation highlights exposures over a relatively short time horizon, valuation analysis incorporates all cash flows over the
estimated remaining life of all balance sheet and derivative positions. The valuation of the balance sheet, at a point in time, is
defined as the discounted present value of asset cash flows and derivative cash flows minus the discounted value of liability
cash flows, the net of which is referred to as MVE. The sensitivity of MVE to changes in the level of interest rates is a
measure of the longer-term repricing risk and options risk embedded in the balance sheet. Similar to the net interest income
simulation, MVE uses instantaneous changes in rates. MVE values only the current balance sheet and does not incorporate
the growth assumptions that are used in the net interest income simulation model. As with the net interest income simulation
model, assumptions about the timing and variability of balance sheet cash flows are critical in the MVE analysis. Particularly
important are the assumptions driving prepayments and the expected changes in balances and pricing of the indeterminate
deposit portfolios.
As of December 31, 2009, the MVE profile indicates modest changes with respect to an instantaneous 100 basis point change
in rates.
Rate Shock
(Basis Points) Estimated % Change in MVE
December 31, 2009 December 31, 2008
+100 (4.2%) (4.2%)
-100 2.3% 1.8%
While an instantaneous and severe shift in interest rates is used in this analysis to provide an estimate of exposure under an
extremely adverse scenario, we believe that a gradual shift in interest rates would have a much more modest impact. Since
MVE measures the discounted present value of cash flows over the estimated lives of instruments, the change in MVE does
not directly correlate to the degree that earnings would be impacted over a shorter time horizon (i.e., the current fiscal year).
Further, MVE does not take into account factors such as future balance sheet growth, changes in product mix, changes in
55