Telus 2011 Annual Report Download - page 83
Download and view the complete annual report
Please find page 83 of the 2011 Telus annual report below. You can navigate through the pages in the report by either clicking on the pages listed below, or by using the keyword search tool below to find specific information within the annual report.-
 1
1 -
2
-
3
-
4
-
5
-
6
-
7
-
8
-
9
-
10
-
11
-
12
-
13
-
14
-
15
-
16
-
17
-
18
-
19
-
20
-
21
-
22
-
23
-
24
-
25
-
26
-
27
-
28
-
29
-
30
-
31
-
32
-
33
-
34
-
35
-
36
-
37
-
38
-
39
-
40
-
41
-
42
-
43
-
44
-
45
-
46
-
47
-
48
-
49
-
50
-
51
-
52
-
53
-
54
-
55
-
56
-
57
-
58
-
59
-
60
-
61
-
62
-
63
-
64
-
65
-
66
-
67
-
68
-
69
-
70
-
71
-
72
-
 73
73 -
 74
74 -
 75
75 -
 76
76 -
 77
77 -
 78
78 -
 79
79 -
 80
80 -
 81
81 -
 82
82 -
 83
83 -
 84
84 -
 85
85 -
 86
86 -
 87
87 -
 88
88 -
 89
89 -
 90
90 -
 91
91 -
 92
92 -
 93
93 -
94
-
95
-
96
-
97
-
98
-
99
-
100
-
101
-
102
-
103
-
104
-
105
-
106
-
107
-
108
-
109
-
110
-
111
-
112
-
113
-
114
-
115
-
116
-
117
-
118
-
119
-
120
-
121
-
122
-
123
-
124
-
125
-
126
-
127
-
128
-
129
-
130
-
131
-
132
-
133
-
134
-
135
-
136
-
137
-
138
-
139
-
140
-
141
-
142
-
143
-
144
-
145
-
146
-
147
-
148
-
149
-
150
-
151
-
152
-
153
-
154
-
155
-
156
-
157
-
158
-
159
-
160
-
161
-
162
-
163
-
164
-
165
-
166
-
167
-
168
-
169
-
170
-
171
-
172
-
173
-
174
-
175
-
176
-
177
-
178
-
179
-
180
-
181
-
182
 |
 |

TELUS 2011 ANNUAL REPORT . 79
MANAGEMENT’S DISCUSSION & ANALYSIS: 9
The discussion in this section is qualified in its entirety by the Caution
regarding forward-looking statements at the beginning of the MD&A.
9.1 Telecommunications industry
Canada’s economic growth slowed to an estimated 2.4% in 2011 from
3.2% in 2010. The Bank of Canada reported in its January 2012 Monetary
Policy
Report that it expects Canada’s economic growth to be 2.0%
in 2012 and 2.8% in 2013. Western Canadian provincial economies are
projected to grow at the fastest rates, due to strong global demand
for commodities.
In 2011, revenues in the Canadian telecommunications industry
(including TV and excluding media) grew by an estimated 3% to just
over $51 billion, with wireless and data services continuing to be
growth engines for the sector. Offsetting this growth was continued
wireline indus try weakness in legacy voice service revenues. Bell
Canada (excluding media) and its affiliated companies represented
about 34% of the total industry revenue.
As one of the largest telecommunications companies in Canada,
TELUS generated $10.4 billion in revenues in 2011, or approximately 20%
of the total industry revenue. TELUS’ annual revenue increased by 6.2%,
with wireless revenues and wireline data revenue representing 77% of
total revenues (74% in 2010). The Company has targeted consolidated
revenue growth of 3 to 6% in 2012.
9.2 Wireless
The Canadian wireless industry experienced continued growth in 2011
with estimated year-over-year revenue and EBITDA increases of approx-
imately 4.5% and 2%, respectively (5% and 3%, respectively, in 2010).
The Canadian wireless market continues to grow at a healthy pace
with an estimate of more than 1.6 million new subscribers in 2011 com-
pared to 1.7 million in 2010. This reflects an increase in the penetration
rate in 2011 of approximately 4.3 per centage points to just over 77% of
the population, compared to an increase of approximately 4.4 percentage
points in 2010. The wireless penetration rate in Canada is expected
to increase further in 2012 by between 4.0 and 4.5 percentage points.
At 77% penetration, the wireless market in Canada continues to
support good growth, which is indicated by the generally comparable
market in the U.S. that has a penetration rate of approximately 101%.
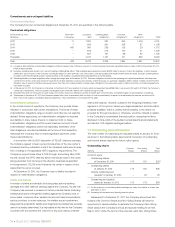
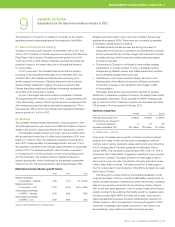
Estimated wireless industry growth factors
2010 2011 2012
Market penetration
of population – Canada 73% 77% 81 to 82%
Market penetration
of population – U.S. 97% 101% 105 to 106%
Data usage (percentage
of ARPU) – Canada 25% 30% 35%
Data usage (percentage
of ARPU) – U.S. 34% 39% 44%
Sources: TELUS estimates and company reports.
Wireless penetration rates in many countries in Western Europe have
significantly surpassed 100%. These rates are not exactly comparable
to Canada for several reasons, including:
.Canada’s wireline local service rates are among the lowest of
Organization for Economic Co-operation and Development countries,
and are priced as flat-rate monthly charges that include all local calls
to wireless phones, while Europe has a calling party pays regime
for wireline local calls
.The tendency in Europe for individuals to have multiple wireless
subscriptions on a single handset, in order to arbitrage roaming
charges among different carriers, also inflates subscription numbers
and understates average revenue per user
.Canada has a much lower population density, as shown in the
following table, which affects the economic efficiency and speed
of providing coverage by next generation technologies to 99%
of the population.
Historically, these factors have reduced the demand for wireless
substitution in Canada as compared to Europe. Yet despite these market
and geographic differences, TELUS provides 4G HSPA+ wireless cover-
age to more than 97% of Canada’s population and launched even faster
LTE services in 14 urban centres in February 2012.
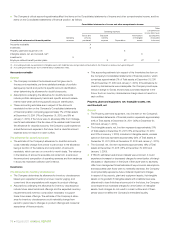
Wireless comparison
Canada U.S. Europe
Total land area (square km) 9 million 9 million 10 million
Subscriptions per square km
of network deployed(1) 12 37 131
Population estimates, 2011 34.7 million 313 million 731 million
(1) Nordicity report – June 2011.
A key driver of wireless revenue growth continues to be the increased
adoption and usage of data services such as messaging, social net-
working, web browsing, application usage, gaming and video-streaming.
In 2011, wireless data in Canada represented an estimated 30% of
industry ARPU. This compares to approximately 39% in the U.S., 31% in
Europe and 52% in Asia-Pacific, suggesting a significant ongoing growth
opportunity in Canada. The higher proportion of data usage in Asia is
due in part to a very low rate of penetration of wireline Internet to house-
holds in many Asian countries. The higher proportion of data usage in
the U.S. is due in part to the introduction of the iPhone by Apple two years
earlier than in Canada.
This data growth is being driven by the increasing availability, model
range and popularity of iPhone, Android and BlackBerry smartphones, as
well as increased adoption of tablets and mobile Internet keys. Increasing
sales of more expensive smartphones are impacting industry margins.
With a multi-year sales agreement, there is usually a large upfront device
subsidy provided to the customer that initially results in a negative return,
but also provides higher ARPU and lower churn rates, which result in
higher average lifetime revenue and value. Tablet devices oper ating on
mobile networks or Wi-Fi are expected to be a growth seg ment in 2012.
Customers increasingly want mobile connectivity to the Internet, and
are increasingly using enhanced portable computing services.
9GENERAL OUTLOOK
Expectations for the telecommunications industry in 2012