Telus 2011 Annual Report Download - page 66
Download and view the complete annual report
Please find page 66 of the 2011 Telus annual report below. You can navigate through the pages in the report by either clicking on the pages listed below, or by using the keyword search tool below to find specific information within the annual report.-
 1
1 -
2
-
3
-
4
-
5
-
6
-
7
-
8
-
9
-
10
-
11
-
12
-
13
-
14
-
15
-
16
-
17
-
18
-
19
-
20
-
21
-
22
-
23
-
24
-
25
-
26
-
27
-
28
-
29
-
30
-
31
-
32
-
33
-
34
-
35
-
36
-
37
-
38
-
39
-
40
-
41
-
42
-
43
-
44
-
45
-
46
-
47
-
48
-
49
-
50
-
51
-
52
-
53
-
54
-
55
-
 56
56 -
 57
57 -
 58
58 -
 59
59 -
 60
60 -
 61
61 -
 62
62 -
 63
63 -
 64
64 -
 65
65 -
 66
66 -
 67
67 -
 68
68 -
 69
69 -
 70
70 -
 71
71 -
 72
72 -
 73
73 -
 74
74 -
 75
75 -
 76
76 -
77
-
78
-
79
-
80
-
81
-
82
-
83
-
84
-
85
-
86
-
87
-
88
-
89
-
90
-
91
-
92
-
93
-
94
-
95
-
96
-
97
-
98
-
99
-
100
-
101
-
102
-
103
-
104
-
105
-
106
-
107
-
108
-
109
-
110
-
111
-
112
-
113
-
114
-
115
-
116
-
117
-
118
-
119
-
120
-
121
-
122
-
123
-
124
-
125
-
126
-
127
-
128
-
129
-
130
-
131
-
132
-
133
-
134
-
135
-
136
-
137
-
138
-
139
-
140
-
141
-
142
-
143
-
144
-
145
-
146
-
147
-
148
-
149
-
150
-
151
-
152
-
153
-
154
-
155
-
156
-
157
-
158
-
159
-
160
-
161
-
162
-
163
-
164
-
165
-
166
-
167
-
168
-
169
-
170
-
171
-
172
-
173
-
174
-
175
-
176
-
177
-
178
-
179
-
180
-
181
-
182
 |
 |

62 . TELUS 2011 ANNUAL REPORT
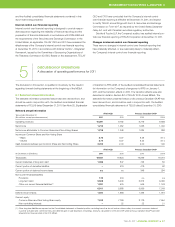
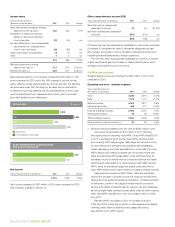
Income taxes
Years ended December 31
($ millions, except tax rates) 2 0 11 2010 Change
Basic blended tax at weighted average
statutory income tax rates 433 402 7.7%
Revaluation of deferred income tax
liability to reflect future statutory
income tax rates (37) (44) n/m
Tax rate differential on, and consequential
adjustments from, reassessments
of prior years’ tax issues (20) (35) n/m
Share option award compensation (1) 10 n/m
Other 1 2 n/m
376 335 12.2%
Blended federal and provincial
statutory tax rates (%) 27.2 29.0 (1.8) pts.
Effective tax rates (%) 23.6 24.1 (0.5) pts.
Basic blended statutory income taxes increased by $31 million in 2011
when compared to 2010 due to the 14% increase in pre-tax income,
partly offset by a lower blended statutory income tax rate. The effective
tax rates were lower than the statutory tax rates due to revaluations
of deferred income tax liabilities; the tax rate differential on, and conse-
quential adjustments from, reassessments of prior years’ tax issues;
and other taxable income differences.
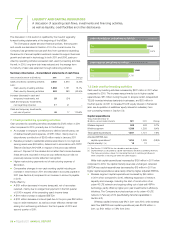
10
09
08
07
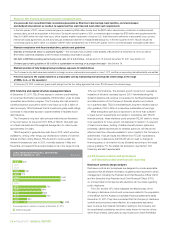
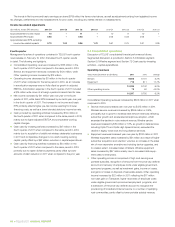
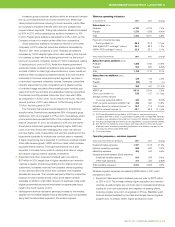
Net income
Income before income taxes
NET INCOME ($ millions)
11 1,215
11
10
10 1,387
1,052
1,591
10
09
BASIC EARNINGS PER COMMON SHARE
AND NON-VOTING SHARE ($)
11 3.76
3.27
10
Net income
Years ended December 31 ($ millions) 2 0 11 2010 Change
1,215 1,052 15.5%
Net income increased by $163 million in 2011 when compared to 2010.
See summary analysis in Section 1.3.
Other comprehensive income (OCI)
Years ended December 31 ($ millions) 2 0 11 2010 Change
Items that may be subsequently
reclassified to income 10 54 (81.5)%
Item never subsequently reclassified
to income (851) (214) n/m
(841) (160) n/m
OCI items that may be subsequently reclassified to income are comprised
of changes in unrealized fair value of derivatives designated as cash
flow hedges, and foreign currency translation adjustments arising from
translating financial statements of foreign operations.
The OCI item never subsequently reclassified to income is in respect
of after-tax actuarial gains and losses on defined benefit plans, which
are likely to fluctuate from period to period.
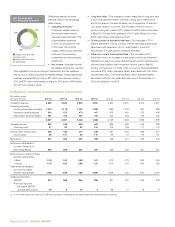
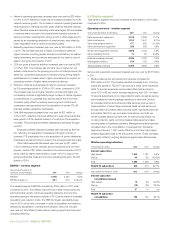
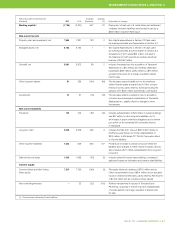
5.4 Wireless segment
Wireless segment revenues increased by $455 million in 2011 when
compared to 2010.
Operating revenues – wireless segment
Years ended December 31
($ in millions, except ratios) 2 0 11 2010 Change
Voice 3,326 3,470 (4.1)%
Data 1,678 1,141 47.1%
Network revenue 5,004 4,611 8.5%
Equipment and other 458 401 14.2%
External operating revenues 5,462 5,012 9.0%
Intersegment revenue 38 33 15.2%
Total operating revenues 5,500 5,045 9.0%
Data revenue to network revenue (%) 34 25 9 pts.
.Network revenue increased year over year by $393 million in 2011.
Voice revenue decreased by $144 million in 2011 reflecting
the ongoing trend of declining voice ARPU. Voice ARPU was $39.20
in 2011, a decrease of $4.05 (9.4%). Voice ARPU declines reflect
an increasing shift towards higher data usage as customers move
to more data-centric rate plans and substitute text messaging,
instant messaging and voice applications for voice calls. The voice
ARPU decline also reflects increased use of included-minute rate
plans
as subscribers shift usage patterns and optimize pricing, an
increasing
volume of mobile Internet connection devices and tablet
subscriptions where there is no voice revenue, lower MikeTM service
ARPU, lower long distance usage and greater penetration of the
lower ARPU Koodo brand, partly offset by increased roaming volumes.
Data revenue increased by $537 million, reflecting subscriber
growth and strength in smartphone service revenues and text mes-
saging driven by greater smartphone penetration, increased adoption
of data plans, growth in the usage of mobile Internet connection
devices and tablets, increased rates for pay-per-use text messaging,
as well as higher data roaming volumes partly offset by lower roaming
rates. Data ARPU was $19.90 in 2011, an increase of $5.51 or 38%
from 2010.
Blended ARPU was $59.10 in 2011, an increase of $1.46 or
2.5% from 2010, mainly due to growth in data usage and increased
roaming, partly offset by declining voice usage and pricing.
See Section 5.2 for ARPU trends.