Telus 2011 Annual Report Download - page 68
Download and view the complete annual report
Please find page 68 of the 2011 Telus annual report below. You can navigate through the pages in the report by either clicking on the pages listed below, or by using the keyword search tool below to find specific information within the annual report.-
 1
1 -
2
-
3
-
4
-
5
-
6
-
7
-
8
-
9
-
10
-
11
-
12
-
13
-
14
-
15
-
16
-
17
-
18
-
19
-
20
-
21
-
22
-
23
-
24
-
25
-
26
-
27
-
28
-
29
-
30
-
31
-
32
-
33
-
34
-
35
-
36
-
37
-
38
-
39
-
40
-
41
-
42
-
43
-
44
-
45
-
46
-
47
-
48
-
49
-
50
-
51
-
52
-
53
-
54
-
55
-
56
-
57
-
 58
58 -
 59
59 -
 60
60 -
 61
61 -
 62
62 -
 63
63 -
 64
64 -
 65
65 -
 66
66 -
 67
67 -
 68
68 -
 69
69 -
 70
70 -
 71
71 -
 72
72 -
 73
73 -
 74
74 -
 75
75 -
 76
76 -
 77
77 -
 78
78 -
79
-
80
-
81
-
82
-
83
-
84
-
85
-
86
-
87
-
88
-
89
-
90
-
91
-
92
-
93
-
94
-
95
-
96
-
97
-
98
-
99
-
100
-
101
-
102
-
103
-
104
-
105
-
106
-
107
-
108
-
109
-
110
-
111
-
112
-
113
-
114
-
115
-
116
-
117
-
118
-
119
-
120
-
121
-
122
-
123
-
124
-
125
-
126
-
127
-
128
-
129
-
130
-
131
-
132
-
133
-
134
-
135
-
136
-
137
-
138
-
139
-
140
-
141
-
142
-
143
-
144
-
145
-
146
-
147
-
148
-
149
-
150
-
151
-
152
-
153
-
154
-
155
-
156
-
157
-
158
-
159
-
160
-
161
-
162
-
163
-
164
-
165
-
166
-
167
-
168
-
169
-
170
-
171
-
172
-
173
-
174
-
175
-
176
-
177
-
178
-
179
-
180
-
181
-
182
 |
 |

64 . TELUS 2011 ANNUAL REPORT
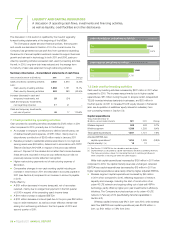
.Network operating expenses increased year over year by $22 million
or 3.4% in 2011, reflecting a lower rate of increase compared to 8.5%
network revenue growth. The increase in network operating expenses
reflects growth in roaming volumes, partly offset by reduced roaming
rates. Revenue-share and licensing costs were largely flat as increases
in revenue-share volumes to third parties and licensing volumes to
service providers, resulting from strong growth in data usage accom-
panied by an increasing penetration of smartphones, were offset by
lower negotiated revenue-share and licensing rates.
.Marketing expenses increased year over year by $24 million or 5.5%
in 2011. The increase was due to higher commissions related to
higher volumes, including greater smartphone activations, as well as
higher advertising and promotions expenses for the back-to-school
season during the third quarter of 2011.
.COA per gross subscriber addition increased year over year by $36
or 10% in 2011. The increase was primarily due to higher per-unit
subsidy costs driven by the growing proportion of smartphones in the
sales mix, competitive pres sures on handset pricing driving deeper
subsidies and, to a lesser extent, higher commissions to support an
increasing number of higher-value smartphone devices.
.Retention costs as a percentage of network revenue increased
by 0.8 percentage points to 12.4% in 2011 when compared to 2010.
The increase was due to higher retention volumes and higher per-
unit subsidy costs as a significantly larger number of clients migrated
to smartphones or upgraded their devices before the end of their
contracts, partly offset by network revenue growth of 8.5% and
commission savings arising from the acquisition of certain TELUS-
branded wireless dealership businesses.
.Total G&A expenses increased year over year by $21 million or
2.3% in 2011, reflecting improved efficiency in supporting subscriber
base growth of 5.1%, despite inclusion of costs from the acquisition
of certain TELUS-branded wireless dealership businesses through-
out 2011.
Employee benefits expense increased year over year by $32 mil-
lion, reflecting compensation increases and a higher number of
domestic FTE employees due to the acquisition of certain dealership
businesses, as well as hiring to support the growing subscriber base.
Other G&A expenses decreased year over year by $11 million
in 2011, reflecting a lower doubtful accounts expense and one-time
supplier credits of $11 million recorded in the second quarter of 2011,
partly offset by higher external labour costs in 2011 to support the
growing subscriber base and one-time operating savings in the first
quarter of 2010.
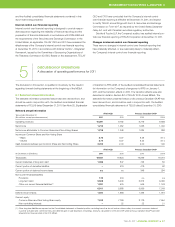
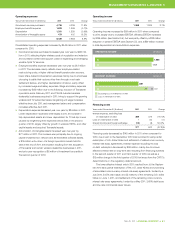
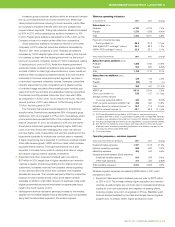
EBITDA – wireless segment
Years ended December 31
($ millions, except margins) 2 0 11 2010 Change
EBITDA 2,186 2,020 8.2%
EBITDA margin (%) 39.7 40.0 (0.3) pts.
The wireless segment EBITDA increased by $166 million in 2011 when
compared to 2010. This reflects improvement in data revenue and post-
paid subscriber growth, improved operating efficiency and one-time
operating savings in the second quarter of 2011, partly offset by increased
acquisition and retention costs. The EBITDA margin was slightly lower
than in 2010, as the rate of increase in costs of acquisition and retention,
affected by acceleration of smartphone adoption rates over the past
year, was not fully offset by data network revenue growth and improved
operating efficiency.
5.5 Wireline segment
Total wireline segment revenues increased by $164 million in 2011 when
compared to 2010.
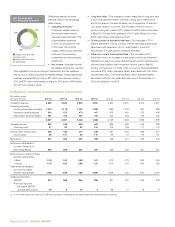
Operating revenues – wireline segment
Years ended December 31 ($ millions) 2 0 11 2010 Change
Data service and equipment 2,578 2,268 13.7%
Voice local service 1,514 1,647 (8.1)%
Voice long distance service 477 530 (10.0)%
Other services and equipment 296 283 4.6%
Service and equipment revenues 4,865 4,728 2.9%
Other operating income 70 52 34.6%
External operating revenues 4,935 4,780 3.2%
Intersegment revenue 164 155 5.8%
Total operating revenues 5,099 4,935 3.3%
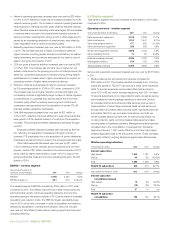
Service and equipment revenues increased year over year by $137 million
in 2011.
.Wireline data service and equipment revenues increased by
$310 mil lion in 2011. The increase resulted principally from: (i) strong
subscriber growth in TELUS TV services as a result of the enhanced
Optik TV service experience and bundled offers first launched in
June 2010, a $3 per month increase beginning April 2011 for basic
TV service subscribers not on rate protection plans, as well as varying
rate increases for theme package selections in April and October;
(ii) increased Internet and enhanced data services revenue due to
implementation of recent large enterprise deals, as well as the pull-
through effect of bundled offers including Optik High Speed services
that enable TELUS to win and retain subscribers, and a $2 per
month increase beginning April 2011 for Internet sub scribers not
on rate protection plans; and (iii) increased data equipment sales,
including sales to business customers. Managed workplace revenues
increased due to the consolidation of revenues from Transactel
beginning February 1, 2011, partly offset by a one-time high-margin
software application sale in the first quarter of 2010. These increases
were partly offset by ongoing declines in legacy basic data services.
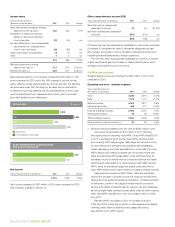
Wireline operating indicators
At December 31 (000s) 2 0 11 2010 Change
Internet subscribers
High-speed 1,242 1,167 6.4%
Dial-up 44 62 (29.0)%
Total 1,286 1,229 4.6%
TELUS TV subscribers 509 314 62.1%
Years ended December 31 (000s) 2 0 11 2010 Change
Internet subscriber
net additions (losses)
High-speed 75 39 92.3%
Dial-up (18) (25) 28.0%
Total 57 14 n/m
TELUS TV subscriber
net additions 196 144 36.1%