Telus 2011 Annual Report Download - page 145
Download and view the complete annual report
Please find page 145 of the 2011 Telus annual report below. You can navigate through the pages in the report by either clicking on the pages listed below, or by using the keyword search tool below to find specific information within the annual report.-
 1
1 -
2
-
3
-
4
-
5
-
6
-
7
-
8
-
9
-
10
-
11
-
12
-
13
-
14
-
15
-
16
-
17
-
18
-
19
-
20
-
21
-
22
-
23
-
24
-
25
-
26
-
27
-
28
-
29
-
30
-
31
-
32
-
33
-
34
-
35
-
36
-
37
-
38
-
39
-
40
-
41
-
42
-
43
-
44
-
45
-
46
-
47
-
48
-
49
-
50
-
51
-
52
-
53
-
54
-
55
-
56
-
57
-
58
-
59
-
60
-
61
-
62
-
63
-
64
-
65
-
66
-
67
-
68
-
69
-
70
-
71
-
72
-
73
-
74
-
75
-
76
-
77
-
78
-
79
-
80
-
81
-
82
-
83
-
84
-
85
-
86
-
87
-
88
-
89
-
90
-
91
-
92
-
93
-
94
-
95
-
96
-
97
-
98
-
99
-
100
-
101
-
102
-
103
-
104
-
105
-
106
-
107
-
108
-
109
-
110
-
111
-
112
-
113
-
114
-
115
-
116
-
117
-
118
-
119
-
120
-
121
-
122
-
123
-
124
-
125
-
126
-
127
-
128
-
129
-
130
-
131
-
132
-
133
-
134
-
 135
135 -
 136
136 -
 137
137 -
 138
138 -
 139
139 -
 140
140 -
 141
141 -
 142
142 -
 143
143 -
 144
144 -
 145
145 -
 146
146 -
 147
147 -
 148
148 -
 149
149 -
 150
150 -
 151
151 -
 152
152 -
 153
153 -
 154
154 -
 155
155 -
156
-
157
-
158
-
159
-
160
-
161
-
162
-
163
-
164
-
165
-
166
-
167
-
168
-
169
-
170
-
171
-
172
-
173
-
174
-
175
-
176
-
177
-
178
-
179
-
180
-
181
-
182
 |
 |

TELUS 2011 ANNUAL REPORT . 141
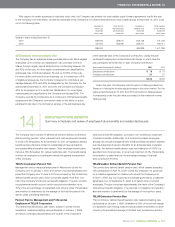
FINANCIAL STATEMENTS & NOTES: 14
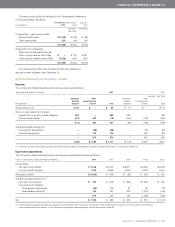
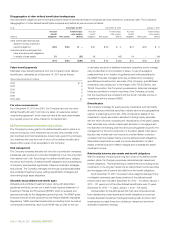
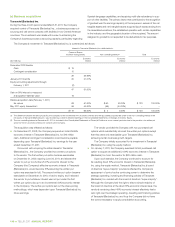
Fair value measurements
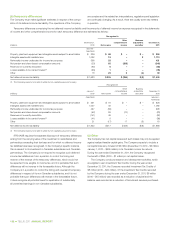
Information about the fair value measurements of the Company’s defined benefit pension plans’ assets, in aggregate, is as follows:
Fair value measurements at reporting date using
Quoted prices in active
Total markets for identical items Other
Dec. 31, Dec. 31, Jan. 1, Dec. 31, Dec. 31, Jan. 1, Dec. 31, Dec. 31, Jan. 1,
As at (millions) 2 0 11 2010 2010 2 0 11 2010 2010 2 0 11 2010 2010
Asset class
Equity securities
Canadian $ß1,998 $ß2,174 $ß1,921 $ß1,632 $ß1,790 $ß1,743 $ 366 $ 384 $ 178
Foreign 1,771 1,589 1,415 1,285 1,122 969 486 467 446
Debt securities
Debt securities issued
by national, provincial
or local governments 1,346 1,357 1,207 946 1,071 1,014 400 286 193
Corporate debt securities 692 558 620 – – – 692 558 620
Asset-backed securities 38 54 45 – – – 38 54 45
Commercial mortgages 253 218 312 – – – 253 218 312
Cash and cash equivalents 213 386 389 1 17 25 212 369 364
Real estate 440 429 393 55 51 45 385 378 348
Other – – 14 – – – – – 14
6,751 6,765 6,316 $ß3,919 $ß4,051 $ß3,796 $ß2,832 $ß2,714 $ß2,520
Effect of asset ceiling limit (5) (5) (5)
$ß6,746 $ß6,760 $ß6,311
As at December 31, 2011, pension and other benefit trusts adminis-
tered by the Company held shares of TELUS Corporation that had a
fair value of $2 million (December 31, 2010 – $5 million; January 1, 2010
– $5 million). As at December 31, 2010, pension and other benefit trusts
administered by the Company leased real estate to the Company with
a fair value of $31 million (January 1, 2010 – $31 million) (the fair value
of the leased real estate was not determinable by a quoted price in an
active market for an identical item); as at December 31, 2011, pension
and other benefit trusts administered by the Company did not lease real
estate to the Company.
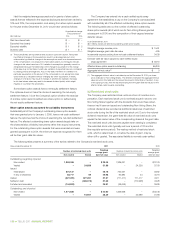
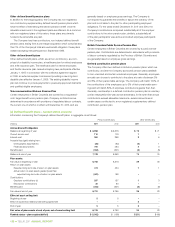
(c) Other defined benefit plans – details
Expense
The Company’s other defined benefit plan expense was as follows:
Years ended December 31 (millions) 2 0 11 2010
(adjusted – Note 25(c))
Employee Other Employee Other
benefits comprehensive benefits comprehensive
Recognized in expense income Total expense income Total
Current service cost $ß 1 $ß – $ß 1 $ß – $ß – $ß –
Return on plan assets net of interest
Interest cost on accrued benefit obligation 2 – 2 5 – 5
Return on plan assets(1) (1) – (1) (1) – (1)
1 – 1 4 – 4
Actuarial loss (gain) arising from:
Demographic assumptions – (2) (2) – 1 1
Financial assumptions – 4 4 – 3 3
– 2 2 – 4 4
Change in the effect of limiting net defined
benefit assets to the asset ceiling – 2 2 – – –
$ß 2 $ß 4 $ß 6 $ß 4 $ß 4 $ß 8
(1) The return on plan assets included in employee benefits expense reflects management’s expected long-term rate of return, as discussed further in (f).