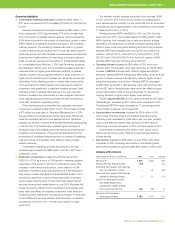
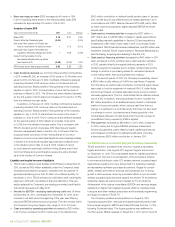
Telus 2011 Annual Report Download - page 36
Download and view the complete annual report
Please find page 36 of the 2011 Telus annual report below. You can navigate through the pages in the report by either clicking on the pages listed below, or by using the keyword search tool below to find specific information within the annual report.
32 . TELUS 2011 ANNUAL REPORT
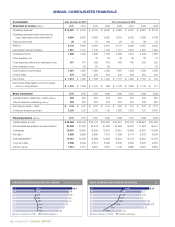
9.8
10.4
8.7
8.1
9.7
9.1
9.6
9.8
36.3
37.3
37.3
36.3
41.6
40.8
41.4
39.1
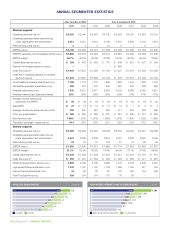
OPERATING REVENUES AND EBITDA8 MARGIN ($ billions and %)
EBITDA margin (%)
11
10
10
09
08
07
06
05
prior to transition to IFRS
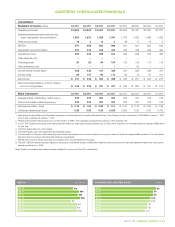
ANNUAL CONSOLIDATED FINANCIALS
Consolidated After transition to IFRS1 Prior to transition to IFRS
Statement of income (millions) 2 0 11 2010 2010 2009 2008 2007 2006 2005
Operating revenues2 $ß10,397 $ß 9,792 $ß 9,779 $ß 9,606 $ß 9,653 $ß 9,074 $ß 8,681 $ß 8,143
Operating expenses before restructuring
costs, depreciation and amortization3 6,584 6,062 6,062 5,925 5,815 5,465 4,998 4,769
Restructuring costs 35 80 74 190 59 20 68 54
EBITDA 3,778 3,650 3,643 3,491 3,779 3,589 3,615 3,320
Depreciation and amortization 1,810 1,741 1,735 1,722 1,713 1,615 1,576 1,624
Operating income 1,968 1,909 1,908 1,769 2,066 1,974 2,039 1,696
Other expense, net – – 32 32 36 36 28 18
Financing costs before debt redemption loss 377 470 458 433 463 440 505 590
Debt redemption loss – 52 52 99 – – – 33
Income before income taxes 1,591 1,387 1,366 1,205 1,567 1,498 1,506 1,055
Income taxes 376 335 328 203 436 233 353 330
Net income $ß 1,215 $ß 1,052 $ß 1,038 $ß 1,002 $ß 1,131 $ß 1,265 $ß 1,153 $ 725
Net income attributable to common shares
and non-voting shares $ß 1,219 $ß 1,048 $ß 1,034 $ 998 $ß 1,128 $ß 1,258 $ß 1,145 $ 717
Share information4 2 0 11 2010 2010 2009 2008 2007 2006 2005
Average shares outstanding – basic (millions) 324 320 320 318 320 332 344 357
Year-end shares outstanding (millions) 325 322 322 318 318 324 338 350
Earnings per share – basic $ß 3.76 $ß 3.27 $ß 3.23 $ß 3.14 $ß 3.52 $ß 3.79 $ß 3.33 $ß 2.01
Dividends declared per share 2.205 2.00 2.00 1.90 1.825 1.575 1.20 0.875
Financial position (millions) 2 0 11 2010 2010 2009 2008 2007 2006 2005
Capital assets, at cost5 $ß36,586 $ß35,203 $ß35,100 $ß34,357 $ß32,581 $ß30,129 $ß28,661 $ß27,456
Accumulated depreciation and amortization5 22,469 21,220 22,244 21,480 20,098 19,007 17,679 16,514
Total assets 19,931 19,624 19,599 19,219 19,021 16,849 16,522 16,208
Net debt6 6,959 6,869 6,869 7,312 7,286 6,141 6,278 6,294
Total capitalization7 14,461 14,649 15,088 14,959 14,524 13,100 13,253 13,190
Long-term debt 5,508 5,209 5,313 6,090 6,348 4,584 3,475 4,616
Owners’ equity 7,513 7,781 8,201 7,575 7,108 6,855 6,975 6,896
3.27
3.76
3.33
3.52
3.79
3.14
3.23
1. 90
2.00
2.00
2.205
2.01
1.20
0.875
1. 575
1. 825
BASIC EARNINGS AND DIVIDENDS PER SHARE ($)
11
10
10
09
08
07
06
05
dividends per share
prior to transition to IFRS


