Telus 2011 Annual Report Download - page 47
Download and view the complete annual report
Please find page 47 of the 2011 Telus annual report below. You can navigate through the pages in the report by either clicking on the pages listed below, or by using the keyword search tool below to find specific information within the annual report.-
 1
1 -
2
-
3
-
4
-
5
-
6
-
7
-
8
-
9
-
10
-
11
-
12
-
13
-
14
-
15
-
16
-
17
-
18
-
19
-
20
-
21
-
22
-
23
-
24
-
25
-
26
-
27
-
28
-
29
-
30
-
31
-
32
-
33
-
34
-
35
-
36
-
 37
37 -
 38
38 -
 39
39 -
 40
40 -
 41
41 -
 42
42 -
 43
43 -
 44
44 -
 45
45 -
 46
46 -
 47
47 -
 48
48 -
 49
49 -
 50
50 -
 51
51 -
 52
52 -
 53
53 -
 54
54 -
 55
55 -
 56
56 -
 57
57 -
58
-
59
-
60
-
61
-
62
-
63
-
64
-
65
-
66
-
67
-
68
-
69
-
70
-
71
-
72
-
73
-
74
-
75
-
76
-
77
-
78
-
79
-
80
-
81
-
82
-
83
-
84
-
85
-
86
-
87
-
88
-
89
-
90
-
91
-
92
-
93
-
94
-
95
-
96
-
97
-
98
-
99
-
100
-
101
-
102
-
103
-
104
-
105
-
106
-
107
-
108
-
109
-
110
-
111
-
112
-
113
-
114
-
115
-
116
-
117
-
118
-
119
-
120
-
121
-
122
-
123
-
124
-
125
-
126
-
127
-
128
-
129
-
130
-
131
-
132
-
133
-
134
-
135
-
136
-
137
-
138
-
139
-
140
-
141
-
142
-
143
-
144
-
145
-
146
-
147
-
148
-
149
-
150
-
151
-
152
-
153
-
154
-
155
-
156
-
157
-
158
-
159
-
160
-
161
-
162
-
163
-
164
-
165
-
166
-
167
-
168
-
169
-
170
-
171
-
172
-
173
-
174
-
175
-
176
-
177
-
178
-
179
-
180
-
181
-
182
 |
 |

TELUS 2011 ANNUAL REPORT . 43
MANAGEMENT’S DISCUSSION & ANALYSIS: 1
financial targets news release and accompanying investor conference
call on December 16, 2011. In December, management clarified that
consolidated and segmented revenues were trending toward the top
end
of the respective guidance ranges, while consolidated EPS as well
as consolidated and segmented EBITDAs were trending toward the
middle of their respective guidance ranges. Management also indicated
in December that capital expenditures were trending on the high
side of approximately $1.8 billion for 2011. Except for capital expendi-
tures, the August guidance revisions and December expectations
were achieved.
The Company continues to follow its financial objectives, policies
and guidelines, which include generally maintaining a minimum of
$1 billion of unutilized liquidity, a Net debt to EBITDA – excluding restruc-
turing costs ratio in the range of 1.5 to 2.0 times, and a dividend payout
ratio guideline of 55 to 65% of sustainable earnings on a prospective
basis. In addition, under the dividend growth model, and subject to the
Board of Directors’ assessment and determination, the Company expects
to continue with two dividend increases per year to 2013, which would
on an annual basis provide an increase of circa 10%. The dividend
growth model is not necessarily indicative of dividends beyond 2013.
See Section 4.3 for the Company’s capital structure financial policies,
results and plans.
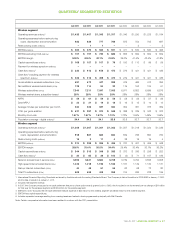
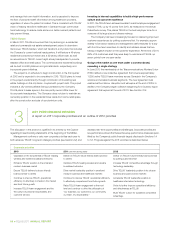
The following Scorecard compares TELUS’ performance to original
2011 targets. It also presents targets for 2012, announced in the Company’s
annual targets conference call and webcast held on December 16, 2011.
See Section 1.5 Financial and operating targets for 2012 and Section 1.6
TELUS segment targets for additional information on expectations and
assumptions for 2012. The 2012 targets, expectations and assumptions
are fully qualified by the Caution regarding forward-looking statements
at the beginning of the MD&A.
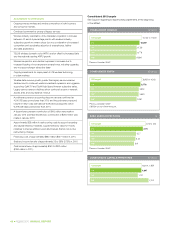
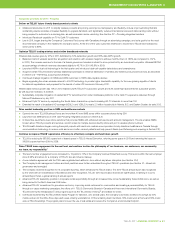
2011 performance
Scorecard Actual results and growth Original targets and expected growth Result 2012 targets and expected growth
Consolidated
Revenues(1) $10.397 billion $9.925 to $10.225 billion $10.7 to $11.0 billion
6.2% 1 to 4% ✓✓ 3 to 6%
EBITDA(2) $3.778 billion $3.675 to $3.875 billion ✓ $3.8 to $4.0 billion
3.5% 1 to 6% 1 to 6%
EPS – basic $3.76 $3.50 to $3.90 ✓ $3.75 to $4.15
15.0% 7 to 19% 0 to 10%
Capital expenditures(1)(3) $1.847 billion Approx. $1.7 billion ✗ Approx. $1.85 billion
7. 3 %
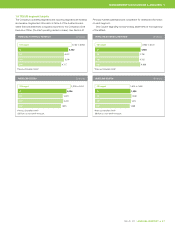
Wireless segment
Revenue (external)(1) $5.462 billion $5.2 to $5.35 billion ✓✓ $5.75 to $5.9 billion
9.0% 4 to 7% 5 to 8%
EBITDA $2.186 billion $2.15 to $2.25 billion ✓ $2.3 to $2.4 billion
8.2% 6 to 11% 5 to 10%
Wireline segment
Revenue (external)(1) $4.935 billion $4.725 to $4.875 billion ✓✓ $4.95 to $5.1 billion
3.2% (1) to 2% 0 to 3%
EBITDA $1.592 billion $1.525 to $1.625 billion ✓ $1.5 to $1.6 billion
(2.3)% (6)% to 0% (6) to 1%
(1) On August 5, 2011, full-year guidance for 2011 was revised to: consolidated revenues of $10.225 to ✓✓ Exceeded target
$10.425 billion (4 to 6% increase over 2010); wireless revenues of $5.4 to $5.5 billion (8 to 10% increase ✓ Met target
over 2010); wireline revenues of $4.825 to $4.925 billion (1 to 3% increase over 2010); and consolidated ✗ Missed target
capital expenditures of approximately $1.8 billion (approximately 5% higher than 2010). Original targets
were reaffirmed for consolidated EBITDA and EPS, and wireless and wireline EBITDAs.
(2) EBITDA is a non-GAAP measure. See definition in Section 11.1.
(3) Excluding any potential capital expenditures for wireless spectrum in 2012.