Telus 2011 Annual Report Download - page 144
Download and view the complete annual report
Please find page 144 of the 2011 Telus annual report below. You can navigate through the pages in the report by either clicking on the pages listed below, or by using the keyword search tool below to find specific information within the annual report.-
 1
1 -
2
-
3
-
4
-
5
-
6
-
7
-
8
-
9
-
10
-
11
-
12
-
13
-
14
-
15
-
16
-
17
-
18
-
19
-
20
-
21
-
22
-
23
-
24
-
25
-
26
-
27
-
28
-
29
-
30
-
31
-
32
-
33
-
34
-
35
-
36
-
37
-
38
-
39
-
40
-
41
-
42
-
43
-
44
-
45
-
46
-
47
-
48
-
49
-
50
-
51
-
52
-
53
-
54
-
55
-
56
-
57
-
58
-
59
-
60
-
61
-
62
-
63
-
64
-
65
-
66
-
67
-
68
-
69
-
70
-
71
-
72
-
73
-
74
-
75
-
76
-
77
-
78
-
79
-
80
-
81
-
82
-
83
-
84
-
85
-
86
-
87
-
88
-
89
-
90
-
91
-
92
-
93
-
94
-
95
-
96
-
97
-
98
-
99
-
100
-
101
-
102
-
103
-
104
-
105
-
106
-
107
-
108
-
109
-
110
-
111
-
112
-
113
-
114
-
115
-
116
-
117
-
118
-
119
-
120
-
121
-
122
-
123
-
124
-
125
-
126
-
127
-
128
-
129
-
130
-
131
-
132
-
133
-
 134
134 -
 135
135 -
 136
136 -
 137
137 -
 138
138 -
 139
139 -
 140
140 -
 141
141 -
 142
142 -
 143
143 -
 144
144 -
 145
145 -
 146
146 -
 147
147 -
 148
148 -
 149
149 -
 150
150 -
 151
151 -
 152
152 -
 153
153 -
 154
154 -
155
-
156
-
157
-
158
-
159
-
160
-
161
-
162
-
163
-
164
-
165
-
166
-
167
-
168
-
169
-
170
-
171
-
172
-
173
-
174
-
175
-
176
-
177
-
178
-
179
-
180
-
181
-
182
 |
 |

140 . TELUS 2011 ANNUAL REPORT
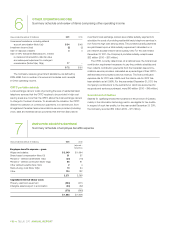
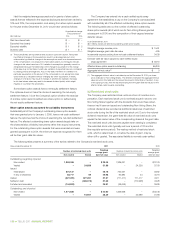
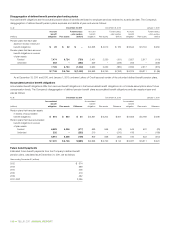
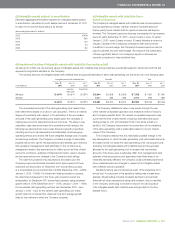
Disaggregation of defined benefit pension plan funding status
Accrued benefit obligations are the actuarial present values of benefits attributed to employee services rendered to a particular date. The Company’s
disaggregation of defined benefit pension plans surpluses and deficits at year-end was as follows:
As at December 31, 2011 December 31, 2010 January 1, 2010
Accrued Funded status Accrued Funded status Accrued Funded status
benefit – plan surplus benefit – plan surplus benefit – plan surplus
(millions) obligation Plan assets (deficit) obligation Plan assets (deficit) obligation Plan assets (deficit)
Pension plans that have plan
assets in excess of accrued
benefit obligations $ 22 $ 22 $ß – $ß4,328 $ß4,510 $ 182 $ß3,544 $ß3,794 $ß250
Pension plans that have accrued
benefit obligations in excess
of plan assets
Funded 7,474 6,724 (750) 2,401 2,250 (151) 2,627 2,517 (110)
Unfunded 252 – (252) 229 – (229) 205 – (205)
7,726 6,724 (1,002) 2,630 2,250 (380) 2,832 2,517 (315)
$ß7,748 $ß6,746 $ß(1,002) $ß6,958 $ß6,760 $ß(198) $ß6,376 $ß6,311 $ (65)
As at December 31, 2011 and 2010, and January 1, 2010, undrawn Letters of Credit secured certain of the unfunded defined benefit pension plans.
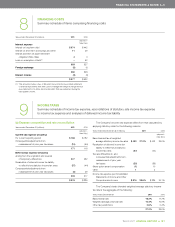
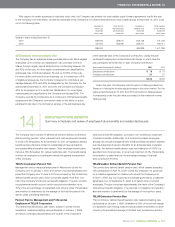
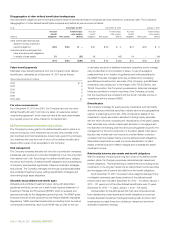
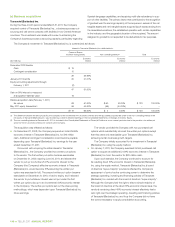
Accumulated pension benefit obligations
Accumulated benefit obligations differ from accrued benefit obligations in that accumulated benefit obligations do not include assumptions about future
compensation levels. The Company’s disaggregation of defined pension benefit plans accumulated benefit obligations and plan assets at year-end
was as follows:
As at December 31, 2011 December 31, 2010 January 1, 2010
Accumulated Accumulated Accumulated
benefit benefit benefit
(millions) obligation Plan assets Difference obligation Plan assets Difference obligation Plan assets Difference
Pension plans that have plan assets
in excess of accumulated
benefit obligations $ 516 $ 540 $ 24 $ß5,857 $ß6,204 $ß347 $ß5,353 $ß5,789 $ß436
Pension plans that have accumulated
benefit obligations in excess
of plan assets
Funded 6,683 6,206 (477) 599 556 (43) 545 522 (23)
Unfunded 232 – (232) 210 – (210) 189 – (189)
6,915 6,206 (709) 809 556 (253) 734 522 (212)
$ß7,431 $ß6,746 $ß(685) $ß6,666 $ß6,760 $ß 94 $ß6,087 $ß6,311 $ß224
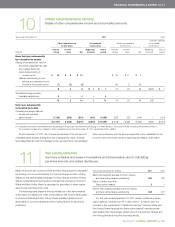
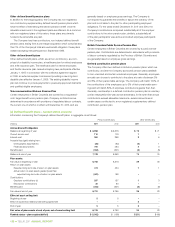
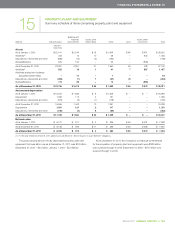
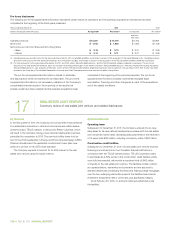
Future benefit payments
Estimated future benefit payments from the Company’s defined benefit
pension plans, calculated as at December 31, 2011, are as follows:
Years ending December 31 (millions)
2012 $ß 374
2013 389
2014 405
2015 419
2016 432
2017–2021 2,295