Telus 2011 Annual Report Download - page 37
Download and view the complete annual report
Please find page 37 of the 2011 Telus annual report below. You can navigate through the pages in the report by either clicking on the pages listed below, or by using the keyword search tool below to find specific information within the annual report.-
 1
1 -
2
-
3
-
4
-
5
-
6
-
7
-
8
-
9
-
10
-
11
-
12
-
13
-
14
-
15
-
16
-
17
-
18
-
19
-
20
-
21
-
22
-
23
-
24
-
25
-
26
-
 27
27 -
 28
28 -
 29
29 -
 30
30 -
 31
31 -
 32
32 -
 33
33 -
 34
34 -
 35
35 -
 36
36 -
 37
37 -
 38
38 -
 39
39 -
 40
40 -
 41
41 -
 42
42 -
 43
43 -
 44
44 -
 45
45 -
 46
46 -
 47
47 -
48
-
49
-
50
-
51
-
52
-
53
-
54
-
55
-
56
-
57
-
58
-
59
-
60
-
61
-
62
-
63
-
64
-
65
-
66
-
67
-
68
-
69
-
70
-
71
-
72
-
73
-
74
-
75
-
76
-
77
-
78
-
79
-
80
-
81
-
82
-
83
-
84
-
85
-
86
-
87
-
88
-
89
-
90
-
91
-
92
-
93
-
94
-
95
-
96
-
97
-
98
-
99
-
100
-
101
-
102
-
103
-
104
-
105
-
106
-
107
-
108
-
109
-
110
-
111
-
112
-
113
-
114
-
115
-
116
-
117
-
118
-
119
-
120
-
121
-
122
-
123
-
124
-
125
-
126
-
127
-
128
-
129
-
130
-
131
-
132
-
133
-
134
-
135
-
136
-
137
-
138
-
139
-
140
-
141
-
142
-
143
-
144
-
145
-
146
-
147
-
148
-
149
-
150
-
151
-
152
-
153
-
154
-
155
-
156
-
157
-
158
-
159
-
160
-
161
-
162
-
163
-
164
-
165
-
166
-
167
-
168
-
169
-
170
-
171
-
172
-
173
-
174
-
175
-
176
-
177
-
178
-
179
-
180
-
181
-
182
 |
 |

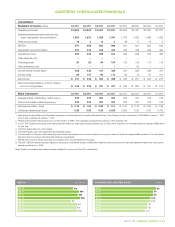
TELUS 2011 ANNUAL REPORT . 33
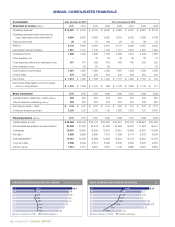
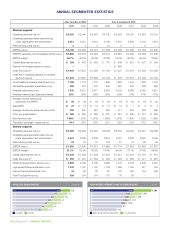
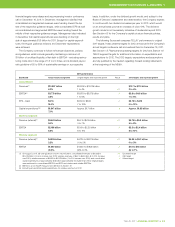
QUARTERLY CONSOLIDATED FINANCIALS
950
968
943
941
925
841
874
986
EBITDA ($ millions)
Q4 11
Q3 11
Q2 11
Q1 11
Q4 10
Q3 10
Q2 10
Q1 10
Consolidated
Statement of income (millions) Q4 2011 Q3 2011 Q2 2011 Q1 2011 Q4 2010 Q3 2010 Q2 2010 Q1 2010
Operating revenues2 $ß2,690 $ß2,622 $ß2,554 $ß2,531 $ß2,554 $ß2,461 $ß2,400 $ß2,377
Operating expenses before restructuring
costs, depreciation and amortization 1,800 1,651 1,592 1,541 1,675 1,503 1,456 1,428
Restructuring costs 16 3 12 4 38 17 19 6
EBITDA 874 968 950 986 841 941 925 943
Depreciation and amortization 481 443 442 444 445 433 409 454
Operating income 393 525 508 542 396 508 516 489
Other expense, net – – – – – – – –
Financing costs 87 92 94 104 105 133 117 115
Debt redemption loss – – – – – 52 – –
Income before income taxes 306 433 414 438 291 323 399 374
Income taxes 69 107 90 110 65 72 97 101
Net income $ 237 $ 326 $ 324 $ 328 $ 226 $ 251 $ 302 $ 273
Net income attributable to common shares
and non-voting shares $ 246 $ 325 $ 321 $ 327 $ 225 $ 250 $ 301 $ 272
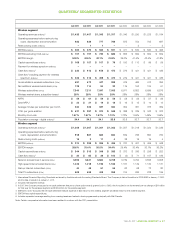
Share information4 Q4 2011 Q3 2011 Q2 2011 Q1 2011 Q4 2010 Q3 2010 Q2 2010 Q1 2010
Average shares outstanding – basic (millions) 325 325 324 324 322 321 319 318
Period-end shares outstanding (millions) 325 325 324 324 322 321 319 318
Earnings per share – basic $ß 0.76 $ß 1.00 $ß 0.99 $ß 1.01 $ß 0.70 $ß 0.78 $ß 0.94 $ß 0.85
Dividends declared per share 0.58 0.55 0.55 0.525 0.525 0.50 0.50 0.475
55
55
47.5
50
50
52.5
58
52.5
DIVIDENDS DECLARED PER SHARE (cents)
Q4 11
Q3 11
Q2 11
Q1 11
Q4 10
Q3 10
Q2 10
Q1 10
1 International Financial Reporting Standards as issued by the International Accounting Standards Board. The Company’s date of transition to IFRS-IASB is January 1, 2010,
and its date of adoption is January 1, 2011.
2 IFRS includes certain revenues that, prior to the transition to IFRS, were classified as expense recoveries or Other expense, net.
3
In 2007, the Company introduced a net-cash settlement feature for share option awards granted prior to 2005, which resulted in an incremental pre-tax charge of $169 million
for that year.
4 Common shares and non-voting shares.
5 Includes Property, plant and equipment and Intangible assets.
6
The summation of Long-term debt excluding unamortized debt issuance cost, current maturities of Long-term debt, net deferred hedging liability related to U.S. dollar Notes
and
short-term borrowings, less Cash and temporary investments.
7 Net debt plus Owners’ equity excluding accumulated other comprehensive income (loss).
8 The 2007 EBITDA margin has been adjusted to exclude an incremental charge of $169 million relating to the introduction of a net-cash settlement feature for share option
awards granted prior to 2005.
Note: Certain comparative information has been restated to conform with the 2011 presentation.