Telus 2011 Annual Report Download - page 40
Download and view the complete annual report
Please find page 40 of the 2011 Telus annual report below. You can navigate through the pages in the report by either clicking on the pages listed below, or by using the keyword search tool below to find specific information within the annual report.-
 1
1 -
2
-
3
-
4
-
5
-
6
-
7
-
8
-
9
-
10
-
11
-
12
-
13
-
14
-
15
-
16
-
17
-
18
-
19
-
20
-
21
-
22
-
23
-
24
-
25
-
26
-
27
-
28
-
29
-
 30
30 -
 31
31 -
 32
32 -
 33
33 -
 34
34 -
 35
35 -
 36
36 -
 37
37 -
 38
38 -
 39
39 -
 40
40 -
 41
41 -
 42
42 -
 43
43 -
 44
44 -
 45
45 -
 46
46 -
 47
47 -
 48
48 -
 49
49 -
 50
50 -
51
-
52
-
53
-
54
-
55
-
56
-
57
-
58
-
59
-
60
-
61
-
62
-
63
-
64
-
65
-
66
-
67
-
68
-
69
-
70
-
71
-
72
-
73
-
74
-
75
-
76
-
77
-
78
-
79
-
80
-
81
-
82
-
83
-
84
-
85
-
86
-
87
-
88
-
89
-
90
-
91
-
92
-
93
-
94
-
95
-
96
-
97
-
98
-
99
-
100
-
101
-
102
-
103
-
104
-
105
-
106
-
107
-
108
-
109
-
110
-
111
-
112
-
113
-
114
-
115
-
116
-
117
-
118
-
119
-
120
-
121
-
122
-
123
-
124
-
125
-
126
-
127
-
128
-
129
-
130
-
131
-
132
-
133
-
134
-
135
-
136
-
137
-
138
-
139
-
140
-
141
-
142
-
143
-
144
-
145
-
146
-
147
-
148
-
149
-
150
-
151
-
152
-
153
-
154
-
155
-
156
-
157
-
158
-
159
-
160
-
161
-
162
-
163
-
164
-
165
-
166
-
167
-
168
-
169
-
170
-
171
-
172
-
173
-
174
-
175
-
176
-
177
-
178
-
179
-
180
-
181
-
182
 |
 |

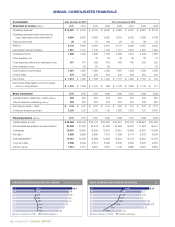
36 . TELUS 2011 ANNUAL REPORT
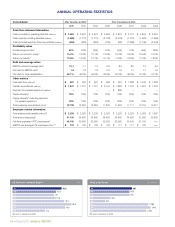
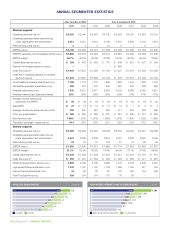
ANNUAL SEGMENTED STATISTICS
After transition to IFRS1 Prior to transition to IFRS
2 0 11 2010 2010 2009 2008 2007 2006 2005
Wireless segment
Operating revenues (millions)2 $ß5,500 $ß5,045 $ß5,047 $ß4,735 $ß4,660 $ß4,291 $ß3,881 $ß3,319
Operating expenses before restructuring
costs, depreciation and amortization3 3,312 3,021 3,012 2,790 2,647 2,384 2,122 1,874
Restructuring costs (millions) 2 4 4 12 8 1 6 –
EBITDA (millions)
$ß2,186 $ß2,020 $ß2,031 $ß1,933 $ß2,005 $ß1,906 $ß1,753 $ß1,445
EBITDA4 excluding cost of acquisition (COA) (millions)
$ß2,880 $ß2,618 $ß2,629 $ß2,472 $ß2,587 $ß2,495 $ß2,286 $ß1,939
EBITDA margin4
39.7% 40.0% 40.2% 40.8% 43.0% 45.0% 45.2% 43.5%
Capital expenditures (millions) $ 508 $ 463 $ 463 $ 770 $ 548 $ 551 $ 427 $ 405
Payment for wireless spectrum (millions) – – – – $ 882 – – –
Cash flow (millions)4,5 $ß1,678 $ß1,557 $ß1,568 $ß1,163 $ß1,457 $ß1,379 $ß1,326 $ß1,040
Cash flow4,5 including payment for wireless
spectrum (millions) $ß1,678 $ß1,557 $ß1,568 $ß1,163 $ 575 $ß1,379 $ß1,326 $ß1,040
Gross additions wireless subscribers (000s) 1,798 1,710 1,710 1,599 1,655 1,434 1,293 1,279
Net additions wireless subscribers (000s) 369 447 447 406 561 515 535 584
Wireless subscribers (000s) 7,340 6,971 6,971 6,524 6,129 5,568 5,056 4,521
Wireless market share, subscriber-based 28% 28% 28% 28% 28% 27% 27% 27%
Average monthly revenue per
subscriber unit (ARPU) $ 59 $ 58 $ 58 $ 58 $ 63 $ 64 $ 63 $ 62
Data ARPU $ 20 $ 14 $ 14 $ 12 $ 10 $ 7 $ 5 $ 3
Average minutes per subscriber per month 332 361 361 392 411 404 403 399
COA, per gross addition $ 386 $ 350 $ 350 $ 337 $ 351 $ 395 $ 412 $ 386
Monthly churn rate 1.68% 1.57% 1.57% 1.58% 1.57% 1.45% 1.33% 1.39%
Population coverage – digital (millions)6 34.4 33.8 33.8 33.1 32.6 31.6 31.0 30.6
Wireline segment
Operating revenues (millions)2 $ß5,099 $ß4,935 $ß4,920 $ß5,033 $ß5,152 $ß4,924 $ß4,921 $ß4,938
Operating expenses before restructuring
costs, depreciation and amortization3 3,474 3,229 3,238 3,297 3,327 3,222 2,997 3,009
Restructuring costs (millions) 33 76 70 178 51 19 62 54
EBITDA (millions) $ß1,592 $ß1,630 $ß1,612 $ß1,558 $ß1,774 $ß1,683 $ß1,862 $ß1,875
EBITDA margin4 31.2% 33.0% 32.8% 31.0% 34.4% 37.1% 37.8% 38.0%
Capital expenditures (millions) $ß1,339 $ß1,258 $ß1,258 $ß1,333 $ß1,311 $ß1,219 $ß1,191 $ 914
Cash flow (millions)4,5 $ 253 $ 372 $ 354 $ 225 $ 463 $ 609 $ 671 $ 961
Network access lines in service (000s) 3,593 3,739 3,739 3,966 4,176 4,333 4,548 4,691
High-speed Internet subscribers (000s) 1,242 1,167 1,167 1,128 1,096 1,020 917 763
Dial-up Internet subscribers (000s) 44 62 62 87 124 155 194 236
Total TV subscribers (000s) 509 314 314 170 78 35 – –
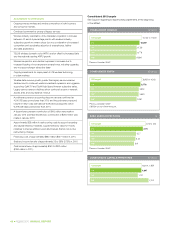
postpaid prepaid
7. 0
7.3
4.5
5.6
5.1
6.1
6.5
WIRELESS SUBSCRIBERS (millions)
11
10
09
08
07
06
05
4.9
5.3
5.7
6.1
3.7
4.1
4.5
high-speed Internet subscribersTV subscribers
1,481
1,751
763
1,055
917
1,174
1, 298
HIGH-SPEED INTERNET AND TV SUBSCRIBERS (000s)
11
10
09
08
07
06
05
1,096
1,128
1,167
1,242
1,020