Telus 2011 Annual Report Download - page 125
Download and view the complete annual report
Please find page 125 of the 2011 Telus annual report below. You can navigate through the pages in the report by either clicking on the pages listed below, or by using the keyword search tool below to find specific information within the annual report.
TELUS 2011 ANNUAL REPORT . 121
FINANCIAL STATEMENTS & NOTES: 4
4FINANCIAL INSTRUMENTS
Summary schedules and review of financial instruments, including the management
of associated risks and fair values
(a) Risks – overview
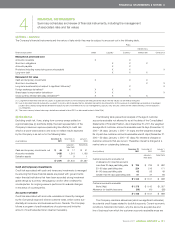
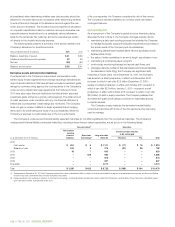
The Company’s financial instruments and the nature of risks which they may be subject to are as set out in the following table.
Risks
Market risks
Financial instrument Credit Liquidity Currency Interest rate Other price
Measured at amortized cost
Accounts receivable X X
Short-term obligations X X X
Accounts payable X X
Provisions (including restructuring accounts payable) X X X
Long-term debt X X X
Measured at fair value
Cash and temporary investments X X X
Short-term investments X X
Long-term investments (not subject to significant influence)(1) X X
Foreign exchange derivatives(2) X X X
Share-based compensation derivatives(2) X X X
Cross currency interest rate swap derivatives(2)(3) X X X X
(1) Long-term investments that are not subject to significant influence of the Company are measured at fair value if the fair values can be reliably measured.
(2) Use of derivative financial instruments is subject to a policy which requires that no derivative transaction be entered into for the purpose of establishing a speculative or leveraged
position (the corollary being that all derivative transactions are to be entered into for risk management purposes only) and sets criteria for the creditworthiness of the transaction
counterparties.
(3) The cross currency interest rate swap derivatives matured in fiscal 2011, as discussed further in Note 20(b).
(b) Credit risk
Excluding credit risk, if any, arising from currency swaps settled on
a gross basis (see (c) and Note 20(b)), the best representation of the
Company’s maximum exposure (excluding tax effects) to credit risk,
which is a worst-case scenario and does not reflect results expected
by the Company, is as set out in the following table:
December 31, December 31, January 1,
As at (millions) 2 0 11 2010 2010
(adjusted – (Note 25(d))
Note 25(d))
Cash and temporary investments, net $ 46 $ 17 $ 41
Accounts receivable 1,428 1,318 1,195
Derivative assets 17 9 1
$ß1,491 $ß1,344 $ß1,237
Cash and temporary investments
Credit risk associated with cash and temporary investments is managed
by ensuring that these financial assets are placed with: governments;
major financial institutions that have been accorded strong investment
grade ratings by a primary rating agency; and/or other creditworthy
counterparties. An ongoing review is performed to evaluate changes
in the status of counterparties.
Accounts receivable
Credit risk associated with accounts receivable is inherently managed
by the Company’s large and diverse customer base, which covers sub-
stantially all consumer and business sectors in Canada. The Company
follows a program of credit evaluations of customers and limits the
amount of credit extended when deemed necessary.
The following table presents an analysis of the age of customer
accounts receivable not allowed for as at the dates of the Consolidated
Statements of Financial Position. As at December 31, 2011, the weighted
average life of customer accounts receivable was 29 days (December 31,
2010 – 28 days; January 1, 2010 – 31 days) and the weighted average
life of past-due customer accounts receivable was 61 days (December 31,
2010 – 59 days; January 1, 2010 – 67 days). No interest is charged on
customer accounts that are current. Thereafter, interest is charged at a
market rate on outstanding balances.
December 31, December 31, January 1,
As at (millions) 2 0 11 2010 2010
(adjusted – (Note 25(d))
Note 25(d))
Customer accounts receivable net
of allowance for doubtful accounts
Less than 30 days past billing date $ 796 $ 785 $ 692
30–60 days past billing date 224 216 171
61–90 days past billing date 65 53 49
Greater than 90 days past billing date
57 47 86
$ß1,142 $ß1,101 $ 998
Customer accounts receivable
(Note 24(a)) $ß1,178 $ß1,142 $ß1,057
Allowance for doubtful accounts (36) (41) (59)
$ß1,142 $ß1,101 $ 998
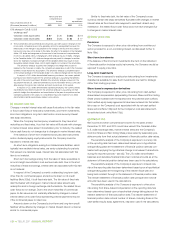
The Company maintains allowances (which are significant estimates)
for potential credit losses related to doubtful accounts. Current economic
conditions, historical information, why the accounts are past-due and
line of business from which the customer accounts receivable arose are


