Telus 2011 Annual Report Download - page 177
Download and view the complete annual report
Please find page 177 of the 2011 Telus annual report below. You can navigate through the pages in the report by either clicking on the pages listed below, or by using the keyword search tool below to find specific information within the annual report.-
 1
1 -
2
-
3
-
4
-
5
-
6
-
7
-
8
-
9
-
10
-
11
-
12
-
13
-
14
-
15
-
16
-
17
-
18
-
19
-
20
-
21
-
22
-
23
-
24
-
25
-
26
-
27
-
28
-
29
-
30
-
31
-
32
-
33
-
34
-
35
-
36
-
37
-
38
-
39
-
40
-
41
-
42
-
43
-
44
-
45
-
46
-
47
-
48
-
49
-
50
-
51
-
52
-
53
-
54
-
55
-
56
-
57
-
58
-
59
-
60
-
61
-
62
-
63
-
64
-
65
-
66
-
67
-
68
-
69
-
70
-
71
-
72
-
73
-
74
-
75
-
76
-
77
-
78
-
79
-
80
-
81
-
82
-
83
-
84
-
85
-
86
-
87
-
88
-
89
-
90
-
91
-
92
-
93
-
94
-
95
-
96
-
97
-
98
-
99
-
100
-
101
-
102
-
103
-
104
-
105
-
106
-
107
-
108
-
109
-
110
-
111
-
112
-
113
-
114
-
115
-
116
-
117
-
118
-
119
-
120
-
121
-
122
-
123
-
124
-
125
-
126
-
127
-
128
-
129
-
130
-
131
-
132
-
133
-
134
-
135
-
136
-
137
-
138
-
139
-
140
-
141
-
142
-
143
-
144
-
145
-
146
-
147
-
148
-
149
-
150
-
151
-
152
-
153
-
154
-
155
-
156
-
157
-
158
-
159
-
160
-
161
-
162
-
163
-
164
-
165
-
166
-
 167
167 -
 168
168 -
 169
169 -
 170
170 -
 171
171 -
 172
172 -
 173
173 -
 174
174 -
 175
175 -
 176
176 -
 177
177 -
 178
178 -
 179
179 -
 180
180 -
 181
181 -
 182
182
 |
 |
TELUS 2011 ANNUAL REPORT . 173
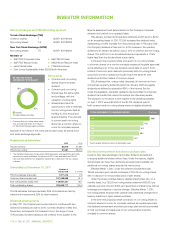
INVESTOR INFORMATION
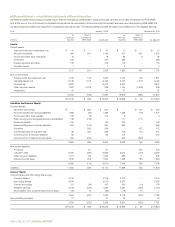
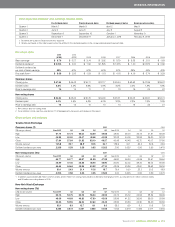
Per-share data
2 0 11 2010
(IFRS) (IFRS) 2009 2008 2007 2006 2005 2004
Basic earnings1 $ß 3.76 $ß 3.27 $ß 3.14 $ß 3.52 $ß 3.79 $ß 3.33 $ß 2.01 $ß 1.63
Dividends declared1 $ß2.205 $ß 2.00 $ß 1.90 $ß1.825 $ß1.575 $ß 1.20 $ß0.875 $ß 0.65
Dividends declared as
per cent of basic earnings 59% 61% 61% 52% 42% 36% 44% 40%
Free cash flow1,2 $ß 3.08 $ß 2.93 $ß 1.53 $ß 1.13 $ß 4.18 $ß 4.19 $ß 3.74 $ß 3.29
Common shares
Closing price $ß57.64 $ß45.48 $ß34.11 $ß37.17 $ß49.44 $ß53.52 $ß47.86 $ß36.22
Dividend yield 3.8% 4.4% 5.6% 4.9% 3.2% 2.2% 1.8% 1.8%
Price to earnings ratio 15 14 11 11 13 16 24 22
Non-voting shares
Closing price $ß54.64 $ß43.25 $ß32.75 $ß34.90 $ß48.01 $ß52.03 $ß46.67 $ß34.74
Dividend yield 4.0% 4.6% 5.8% 5.2% 3.3% 2.3% 1.9% 1.9%
Price to earnings ratio 15 13 10 10 13 16 23 21
1 Per common and non-voting share.
2 For a definition of free cash flow, see Section 11 of Management’s discussion and analysis in this report.
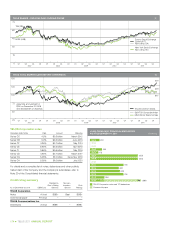
Share prices and volumes
Toronto Stock Exchange
Common shares (T) 2 0 11 2010
(C$ except volume) Year 2011 Q4 Q3 Q2 Q1 Year 2010 Q4 Q3 Q2 Q1
High 57.74 57.74 55.04 53.59 49.98 48.00 48.00 46.19 41.31 38.09
Low 44.98 50.00 49.47 48.08 44.98 32.03 44.05 39.99 36.80 32.03
Close 57.64 57.64 51.35 53.10 49.57 45.48 45.48 45.72 40.17 37.80
Volume (millions)1 145.8 39.7 38.9 32.5 34.7 186.9 42.1 46.2 52.6 45.9
Dividend declared (per share) 2.205 0.58 0.55 0.55 0.525 2.00 0.525 0.50 0.50 0.475
Non-voting shares (T.A) 2 0 11 2010
(C$ except volume) Year 2011 Q4 Q3 Q2 Q1 Year 2010 Q4 Q3 Q2 Q1
High 54.77 54.77 52.67 51.39 47.98 45.90 45.90 44.06 39.51 36.64
Low 42.90 47.45 46.86 46.00 42.90 30.90 42.02 38.40 35.42 30.90
Close 54.64 54.64 48.85 50.82 47.10 43.25 43.25 43.61 38.52 36.34
Volume (millions)1 80.1 24.3 21.4 15.6 18.7 79.4 16.0 23.2 20.2 19.9
Dividend declared (per share) 2.205 0.58 0.55 0.55 0.525 2.00 0.525 0.50 0.50 0.475
1 In addition, approximately 68 million common shares and 37 million non-voting shares traded on alternative exchanges in 2011, as compared to 57 million common shares
and 28 million non-voting shares in 2010.
New York Stock Exchange
Non-voting shares (TU) 2 0 11 2010
(US$ except volume) Year 2011 Q4 Q3 Q2 Q1 Year 2010 Q4 Q3 Q2 Q1
High 55.15 53.75 55.15 53.04 48.95 45.72 45.72 42.95 38.32 36.09
Low 43.09 44.63 46.20 47.80 43.09 28.86 41.22 35.95 33.00 28.86
Close 53.55 53.55 46.24 52.60 48.49 43.56 43.56 42.35 36.20 35.82
Volume (millions) 35.1 8.3 12.7 8.1 6.0 33.2 6.9 8.1 10.3 7.9
Dividend declared (per share) 2.233 0.572 0.557 0.562 0.542 1.943 0.519 0.483 0.477 0.464
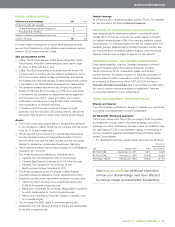
2012 expected dividend1 and earnings release dates
Ex-dividend dates2 Dividend record dates Dividend payment dates Earnings release dates
Quarter 1 March 7 March 9 April 2 May 9
Quarter 2 June 6 June 8 July 3 August 3
Quarter 3 September 6 September 10 October 1 November 9
Quarter 4 December 7 December 11 January 2, 2013 February 8, 2013
1 Dividends are subject to Board of Directors’ approval.
2 Shares purchased on this date forward will not be entitled to the dividend payable on the corresponding dividend payment date.