Telus 2011 Annual Report Download - page 69
Download and view the complete annual report
Please find page 69 of the 2011 Telus annual report below. You can navigate through the pages in the report by either clicking on the pages listed below, or by using the keyword search tool below to find specific information within the annual report.-
 1
1 -
2
-
3
-
4
-
5
-
6
-
7
-
8
-
9
-
10
-
11
-
12
-
13
-
14
-
15
-
16
-
17
-
18
-
19
-
20
-
21
-
22
-
23
-
24
-
25
-
26
-
27
-
28
-
29
-
30
-
31
-
32
-
33
-
34
-
35
-
36
-
37
-
38
-
39
-
40
-
41
-
42
-
43
-
44
-
45
-
46
-
47
-
48
-
49
-
50
-
51
-
52
-
53
-
54
-
55
-
56
-
57
-
58
-
 59
59 -
 60
60 -
 61
61 -
 62
62 -
 63
63 -
 64
64 -
 65
65 -
 66
66 -
 67
67 -
 68
68 -
 69
69 -
 70
70 -
 71
71 -
 72
72 -
 73
73 -
 74
74 -
 75
75 -
 76
76 -
 77
77 -
 78
78 -
 79
79 -
80
-
81
-
82
-
83
-
84
-
85
-
86
-
87
-
88
-
89
-
90
-
91
-
92
-
93
-
94
-
95
-
96
-
97
-
98
-
99
-
100
-
101
-
102
-
103
-
104
-
105
-
106
-
107
-
108
-
109
-
110
-
111
-
112
-
113
-
114
-
115
-
116
-
117
-
118
-
119
-
120
-
121
-
122
-
123
-
124
-
125
-
126
-
127
-
128
-
129
-
130
-
131
-
132
-
133
-
134
-
135
-
136
-
137
-
138
-
139
-
140
-
141
-
142
-
143
-
144
-
145
-
146
-
147
-
148
-
149
-
150
-
151
-
152
-
153
-
154
-
155
-
156
-
157
-
158
-
159
-
160
-
161
-
162
-
163
-
164
-
165
-
166
-
167
-
168
-
169
-
170
-
171
-
172
-
173
-
174
-
175
-
176
-
177
-
178
-
179
-
180
-
181
-
182
 |
 |

TELUS 2011 ANNUAL REPORT . 65
MANAGEMENT’S DISCUSSION & ANALYSIS: 5
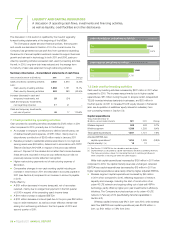
Net additions of high-speed Internet subscribers and TELUS TV
sub scribers improved in 2011 when compared to 2010, due to the
positive effects of the launch of the new Optik service brands in
June 2010. The enhanced bundling capabilities and retention offers,
combined with ongoing service enhancements, have contributed
to increased customer demand and reduced customer churn across
all major product lines. TELUS largely completed the conversion
of IP TV residential subscribers on older technology platforms to
Microsoft Mediaroom technology in the first half of 2011.
.Voice local service revenue decreased by $133 million in 2011.
The decrease reflects reductions in basic access and enhanced voice
service revenues caused by competition for residential subscribers,
the con se quent decline in local residential access lines and matching
of competitive offers, bundled offers in deregulated urban markets,
and technological substitution to wireless and Internet-based
services. The decrease also reflects the decline in business voice
lines resulting from technological substitution to data services
and competitor activity including price competition. These factors
were partly offset by varying increases in monthly local rates.
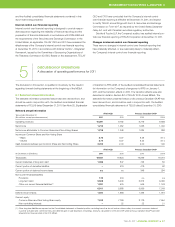
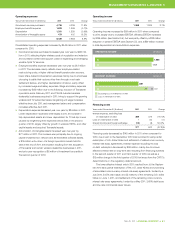
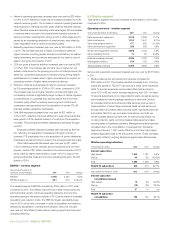
Wireline operating indicators
At December 31 (000s) 2 0 11 2010 Change
Network access lines (NALs)
Residential 1,915 2,046 (6.4)%
Business 1,678 1,693 (0.9)%
Total 3,593 3,739 (3.9)%
Years ended December 31 (000s) 2 0 11 2010 Change
Net (losses) additions in NALs
Residential (131) (177) 26.0%
Business (15) (50) 70.0%
Total (146) (227) 35.7%
Residential NALs continue to be affected by wireless and Internet-
based technological substitution for local services, as well as
promotional activity by primary cable-TV competitors in the Company’s
incumbent areas of B.C., Alberta and Eastern Quebec. Residential
NAL losses improved by 46,000 in 2011 when compared to 2010,
largely due to the sustained positive pull-through effect of bundled
offers, including Optik TV and Optik High Speed Internet services,
which gained traction since being launched in June 2010.
Business NAL losses in 2011 reflect the continuing trend of
increased competition in the SMB market and conversion of voice
lines to more efficient IP-based services, partly offset by the imple-
mentation of voice and data services for a wholesale customer in the
first half of 2011. Growth in certain data services such as private IP
networks is not measured by business NAL counts, and conversion
of legacy voice services to IP-based services results in a decrease
in business NALs.
.Voice long distance service revenue decreased by $53 million in
2011. The decrease reflects ongoing industry-wide price and bundling
competition, losses of local subscribers, and technological substitu-
tion to wireless and Internet-based services.
.Other service and equipment revenues increased by $13 million
in 2011, due to increased voice equipment sales and rent on jointly
used distribution facilities.
.Other operating income increased year over year by $18 million in
2011. The increase reflects higher recoveries of employee costs under
eligible government-sponsored employment programs, a drawdown
of the price cap deferral account to recognize the provisioning of
broadband Internet service to a number of qualifying rural communi-
ties, and the $17 million non-cash gain on Transactel recorded in 2011
(see Section 2.2 Partnering and acquiring), partly offset by lower
portable subsidy revenue.
.Intersegment revenue represents services provided by the wireline
segment to the wireless segment and is eliminated upon consolida tion
together with the associated expense in the wireless segment.
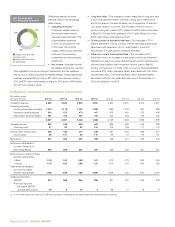
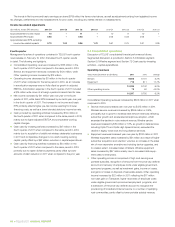
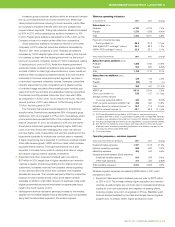
Operating expenses – wireline segment
Years ended December 31 ($ millions) 2 0 11 2010 Change
Goods and services purchased 2,154 1,907 13.0%
Employee benefits expense 1,353 1,398 (3.2)%
3,507 3,305 6.1%
Wireline operating expenses increased year over year by $202 million
in 2011.
.Goods and services expenses increased by $247 million in 2011.
The increase reflects higher content and support costs for TELUS TV
growth (62% year-over-year increase in the subscriber base), higher
cost of goods sold to support increased equipment sales, higher
external labour costs to support a larger customer base, restruc
turing
costs in 2011 associated with real estate consolidation, one-time
supplier credits in the third quarter of 2010 and higher network
transit and termination costs due to increased volumes and higher
blended rates, as well as higher advertising and promotions costs
primarily sup porting Optik TV and Optik High Speed Internet
marketing campaigns.
.Employee benefits expense decreased by $45 million in 2011.
The decrease includes lower employee-related restructuring costs,
higher defined benefit pension plan recoveries, lower share-based
compensation expenses and a one-time benefit liability recovery
in the second quarter of 2011. These decreases were partly offset
by the inclusion of Transactel operations since February 1, 2011,
compensation increases, and a higher number of domestic FTE
employees to support the growing subscriber base.
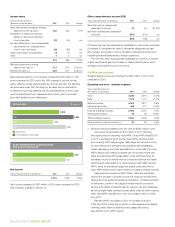
EBITDA – wireline segment
Years ended December 31
($ millions, except margins) 2 0 11 2010 Change
EBITDA 1,592 1,630 (2.3)%
Deduct Transactel gain (17) – n/m
Adjusted EBITDA 1,575 1,630 (3.4)%
Adjusted EBITDA margin (%) 31.0 33.0 (2.0) pts.
The wireline segment EBITDA decreased by $38 million in 2011 when
compared to 2010. Adjusted EBITDA, which excludes the non-cash
Transactel gain, decreased by $55 million in 2011. Decreases in adjusted
EBITDA and adjusted EBITDA margins primarily reflect ongoing declines
in higher-margin legacy voice services that were not fully offset by
growth in lower-margin data services.