Telus 2011 Annual Report Download - page 132
Download and view the complete annual report
Please find page 132 of the 2011 Telus annual report below. You can navigate through the pages in the report by either clicking on the pages listed below, or by using the keyword search tool below to find specific information within the annual report.-
 1
1 -
2
-
3
-
4
-
5
-
6
-
7
-
8
-
9
-
10
-
11
-
12
-
13
-
14
-
15
-
16
-
17
-
18
-
19
-
20
-
21
-
22
-
23
-
24
-
25
-
26
-
27
-
28
-
29
-
30
-
31
-
32
-
33
-
34
-
35
-
36
-
37
-
38
-
39
-
40
-
41
-
42
-
43
-
44
-
45
-
46
-
47
-
48
-
49
-
50
-
51
-
52
-
53
-
54
-
55
-
56
-
57
-
58
-
59
-
60
-
61
-
62
-
63
-
64
-
65
-
66
-
67
-
68
-
69
-
70
-
71
-
72
-
73
-
74
-
75
-
76
-
77
-
78
-
79
-
80
-
81
-
82
-
83
-
84
-
85
-
86
-
87
-
88
-
89
-
90
-
91
-
92
-
93
-
94
-
95
-
96
-
97
-
98
-
99
-
100
-
101
-
102
-
103
-
104
-
105
-
106
-
107
-
108
-
109
-
110
-
111
-
112
-
113
-
114
-
115
-
116
-
117
-
118
-
119
-
120
-
121
-
 122
122 -
 123
123 -
 124
124 -
 125
125 -
 126
126 -
 127
127 -
 128
128 -
 129
129 -
 130
130 -
 131
131 -
 132
132 -
 133
133 -
 134
134 -
 135
135 -
 136
136 -
 137
137 -
 138
138 -
 139
139 -
 140
140 -
 141
141 -
 142
142 -
143
-
144
-
145
-
146
-
147
-
148
-
149
-
150
-
151
-
152
-
153
-
154
-
155
-
156
-
157
-
158
-
159
-
160
-
161
-
162
-
163
-
164
-
165
-
166
-
167
-
168
-
169
-
170
-
171
-
172
-
173
-
174
-
175
-
176
-
177
-
178
-
179
-
180
-
181
-
182
 |
 |
128 . TELUS 2011 ANNUAL REPORT
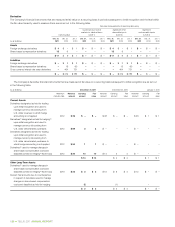
Non-derivative
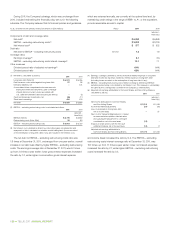
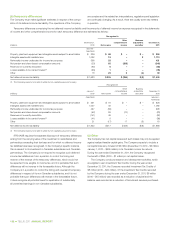
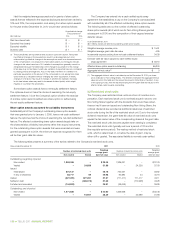
The Company’s long-term debt, which is measured at amortized cost, and the fair value thereof, are as set out in the following table.
As at (millions) December 31, 2011 December 31, 2010 January 1, 2010
Carrying Fair Carrying Fair Carrying Fair
amount value amount value amount value
Long-term debt $ß6,574 $ß7,359 $ß6,056 $ß6,590 $ß6,172 $ß6,656
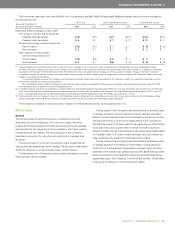
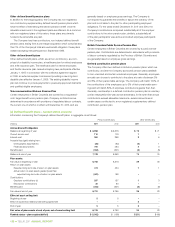
(i) Recognition of derivative gains and losses
The following table sets out the gains and losses, excluding tax effects, on derivative instruments classified as cash flow hedging items and their
location within the Consolidated Statements of Income and Other Comprehensive Income; there was no ineffective portion of derivative instruments
classified as cash flow hedging items for the periods presented.
Amount of gain (loss) recognized Gain (loss) reclassified from other comprehensive
in other comprehensive income income into income (effective portion) (Note 10)
(effective portion) (Note 10) Amount
Years ended December 31 (millions) 2 0 11 2010 Location 2 0 11 2010
Derivatives used to manage currency risks
– Associated with U.S. dollar denominated debt $ (6) $ß 9 Financing costs $ß(8) $ß(59)
– Arising from U.S. dollar denominated purchases 8 (1) Goods and services purchased 3 –
Derivatives used to manage changes in share-based
compensation costs (Note 13(c)) 13 7 Employee benefits expense 12 –
$ß15 $ß15 $ 7 $ß(59)
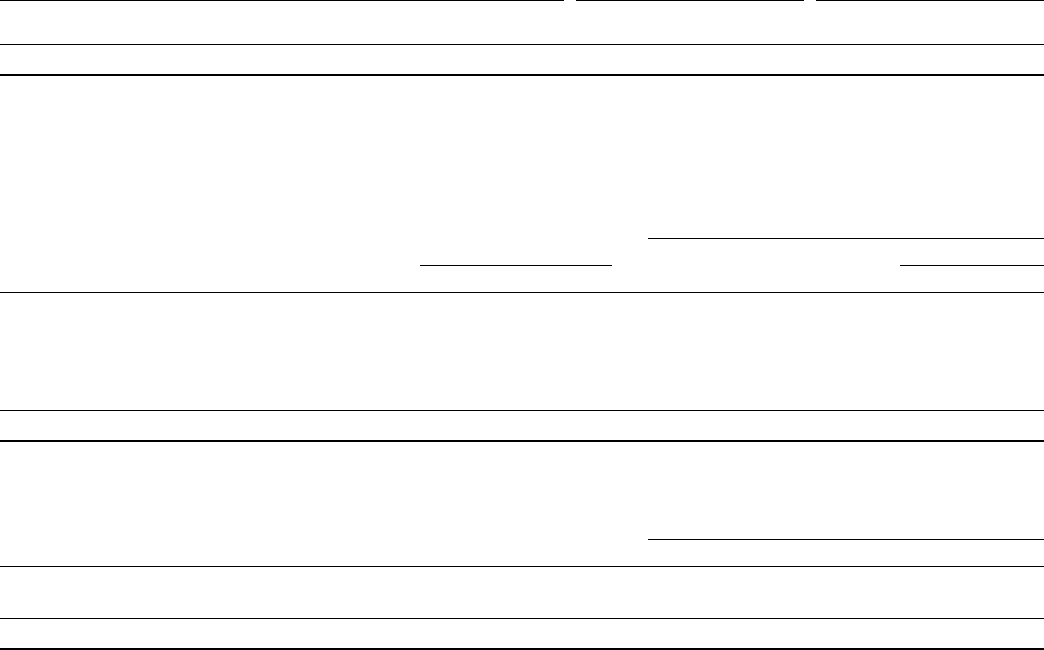
The following table sets out gains and losses arising from derivative instruments that are classified as held for trading items and that are not designated
as being in a hedging relationship, and their location within the Consolidated Statements of Income and Other Comprehensive Income.
Gain (loss) recognized in income on derivatives
Years ended December 31 (millions) Location 2 0 11 2010
Derivatives used to manage currency risks Financing costs $ß 7 $ß –
Derivatives used to manage changes in share-based compensation costs (Note 13(b)) Employee benefits expense 6 24
$ß13 $ß24