Telus 2011 Annual Report Download - page 135
Download and view the complete annual report
Please find page 135 of the 2011 Telus annual report below. You can navigate through the pages in the report by either clicking on the pages listed below, or by using the keyword search tool below to find specific information within the annual report.-
 1
1 -
2
-
3
-
4
-
5
-
6
-
7
-
8
-
9
-
10
-
11
-
12
-
13
-
14
-
15
-
16
-
17
-
18
-
19
-
20
-
21
-
22
-
23
-
24
-
25
-
26
-
27
-
28
-
29
-
30
-
31
-
32
-
33
-
34
-
35
-
36
-
37
-
38
-
39
-
40
-
41
-
42
-
43
-
44
-
45
-
46
-
47
-
48
-
49
-
50
-
51
-
52
-
53
-
54
-
55
-
56
-
57
-
58
-
59
-
60
-
61
-
62
-
63
-
64
-
65
-
66
-
67
-
68
-
69
-
70
-
71
-
72
-
73
-
74
-
75
-
76
-
77
-
78
-
79
-
80
-
81
-
82
-
83
-
84
-
85
-
86
-
87
-
88
-
89
-
90
-
91
-
92
-
93
-
94
-
95
-
96
-
97
-
98
-
99
-
100
-
101
-
102
-
103
-
104
-
105
-
106
-
107
-
108
-
109
-
110
-
111
-
112
-
113
-
114
-
115
-
116
-
117
-
118
-
119
-
120
-
121
-
122
-
123
-
124
-
 125
125 -
 126
126 -
 127
127 -
 128
128 -
 129
129 -
 130
130 -
 131
131 -
 132
132 -
 133
133 -
 134
134 -
 135
135 -
 136
136 -
 137
137 -
 138
138 -
 139
139 -
 140
140 -
 141
141 -
 142
142 -
 143
143 -
 144
144 -
 145
145 -
146
-
147
-
148
-
149
-
150
-
151
-
152
-
153
-
154
-
155
-
156
-
157
-
158
-
159
-
160
-
161
-
162
-
163
-
164
-
165
-
166
-
167
-
168
-
169
-
170
-
171
-
172
-
173
-
174
-
175
-
176
-
177
-
178
-
179
-
180
-
181
-
182
 |
 |

TELUS 2011 ANNUAL REPORT . 131
FINANCIAL STATEMENTS & NOTES: 6 – 9
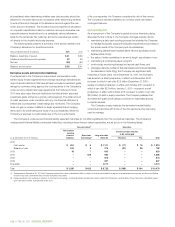
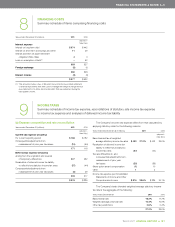
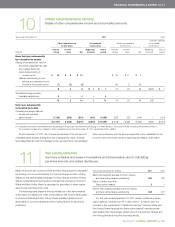
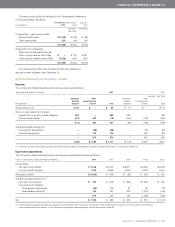
8FINANCING COSTS
Summary schedule of items comprising financing costs
Years ended December 31 (millions) 2 0 11 2010
(adjusted –
Note 25(c))
Interest expense
Interest on long-term debt $ß374 $ß442
Interest on short-term borrowings and other 11 29
Interest accretion on asset retirement
obligation (Note 19(a)) 4 4
Loss on redemption of debt(1) – 52
389 527
Foreign exchange (9) (1)
380 526
Interest income (3) (4)
$ß377 $ß522
(1) This amount includes a loss of $16 which arose from the associated settlement
of financial instruments that were used to manage the foreign exchange rate risk
associated with U.S. dollar denominated debt that was redeemed during the
third quarter of 2010.
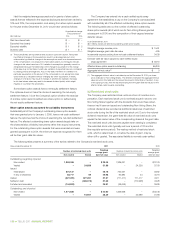
9INCOME TAXES
Summary schedule of income tax expense, reconciliations of statutory rate income tax expense
to income tax expense and analyses of deferred income tax liability
(a) Expense composition and rate reconciliation
Years ended December 31 (millions) 2 0 11 2010
(adjusted –
Note 25(c))
Current tax expense (recovery)
For current reporting period $ß186 $ß182
Consequential adjustments from
reassessment of prior year tax issues (15) (64)
171 118
Deferred tax expense (recovery)
Arising from the origination and reversal
of temporary differences 247 232
Revaluation of deferred income tax liability
to reflect future statutory income tax rates (37) (44)
Consequential adjustments from
reassessment of prior year tax issues (5) 29
205 217
$ß376 $ß335
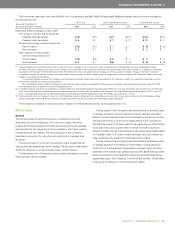
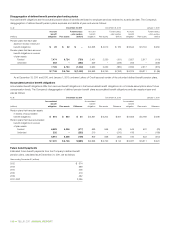
The Company’s income tax expense differs from that calculated by
applying statutory rates for the following reasons:
Years ended December 31 ($ in millions) 2 0 11 2010
(adjusted –
Note 25(c))
Basic blended tax at weighted
average statutory income tax rates $ß433 27.2% $ß402 29.0%
Revaluation of deferred income tax
liability to reflect future statutory
income tax rates (37) (44)
Tax rate differential on, and
consequential adjustments from,
reassessment of prior year
tax issues (20) (35)
Share option award compensation (1) 10
Other 1 2
Income tax expense per Consolidated
Statements of Income and Other
Comprehensive Income $ß376 23.6% $ß335 24.1%
The Company’s basic blended weighted average statutory income
tax rate is the aggregate of the following:
Years ended December 31 2 0 11 2010
Basic federal rate 16.2% 17.7%
Weighted average provincial rate 10.4% 10.9%
Other tax jurisdictions 0.6% 0.4%
27.2% 29.0%