Telus 2011 Annual Report Download - page 5
Download and view the complete annual report
Please find page 5 of the 2011 Telus annual report below. You can navigate through the pages in the report by either clicking on the pages listed below, or by using the keyword search tool below to find specific information within the annual report.-
 1
1 -
 2
2 -
 3
3 -
 4
4 -
 5
5 -
 6
6 -
 7
7 -
 8
8 -
 9
9 -
 10
10 -
 11
11 -
 12
12 -
 13
13 -
 14
14 -
 15
15 -
 16
16 -
17
-
18
-
19
-
20
-
21
-
22
-
23
-
24
-
25
-
26
-
27
-
28
-
29
-
30
-
31
-
32
-
33
-
34
-
35
-
36
-
37
-
38
-
39
-
40
-
41
-
42
-
43
-
44
-
45
-
46
-
47
-
48
-
49
-
50
-
51
-
52
-
53
-
54
-
55
-
56
-
57
-
58
-
59
-
60
-
61
-
62
-
63
-
64
-
65
-
66
-
67
-
68
-
69
-
70
-
71
-
72
-
73
-
74
-
75
-
76
-
77
-
78
-
79
-
80
-
81
-
82
-
83
-
84
-
85
-
86
-
87
-
88
-
89
-
90
-
91
-
92
-
93
-
94
-
95
-
96
-
97
-
98
-
99
-
100
-
101
-
102
-
103
-
104
-
105
-
106
-
107
-
108
-
109
-
110
-
111
-
112
-
113
-
114
-
115
-
116
-
117
-
118
-
119
-
120
-
121
-
122
-
123
-
124
-
125
-
126
-
127
-
128
-
129
-
130
-
131
-
132
-
133
-
134
-
135
-
136
-
137
-
138
-
139
-
140
-
141
-
142
-
143
-
144
-
145
-
146
-
147
-
148
-
149
-
150
-
151
-
152
-
153
-
154
-
155
-
156
-
157
-
158
-
159
-
160
-
161
-
162
-
163
-
164
-
165
-
166
-
167
-
168
-
169
-
170
-
171
-
172
-
173
-
174
-
175
-
176
-
177
-
178
-
179
-
180
-
181
-
182
 |
 |

TELUS 2011 ANNUAL REPORT . 1
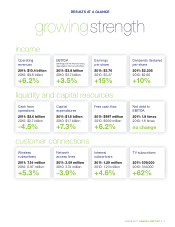
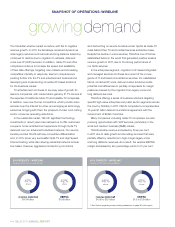
Operating
revenues
2011: $10.4 billion
2010: $9.8 billion
+6.2%
Cash from
operations
2011: $2.6 billion
2010: $2.7 billion
-4.5%
Wireless
subscribers
2011: 7.34 million
2010: 6.97 million
+5.3%
EBITDA
(earnings before interest, taxes,
depreciation and amortization)
2011: $3.8 billion
2010: $3.7 billion
+3.5%
Capital
expenditures
2011: $1.8 billion
2010: $1.7 billion
+7.3%
Network
access lines
2011: 3.59 million
2010: 3.74 million
-3.9%
Earnings
per share
2011: $3.76
2010: $3.27
+15%
Free cash flow
2011: $997 million
2010: $939 million
+6.2%
Internet
subscribers
2011: 1.29 million
2010: 1.23 million
+4.6%
Dividends declared
per share
2011: $2.205
2010: $2.00
+10%
Net debt to
EBITDA
2011: 1.8 times
2010: 1.8 times
no change
TV subscribers
2011: 509,000
2010: 314,000
+62%
RESULTS AT A GLANCE
growingstrength
income
liquidity and capital resources
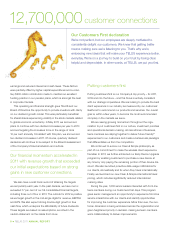
customer connections