Telus 2011 Annual Report Download - page 178
Download and view the complete annual report
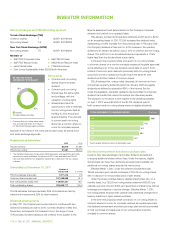
Please find page 178 of the 2011 Telus annual report below. You can navigate through the pages in the report by either clicking on the pages listed below, or by using the keyword search tool below to find specific information within the annual report.-
 1
1 -
2
-
3
-
4
-
5
-
6
-
7
-
8
-
9
-
10
-
11
-
12
-
13
-
14
-
15
-
16
-
17
-
18
-
19
-
20
-
21
-
22
-
23
-
24
-
25
-
26
-
27
-
28
-
29
-
30
-
31
-
32
-
33
-
34
-
35
-
36
-
37
-
38
-
39
-
40
-
41
-
42
-
43
-
44
-
45
-
46
-
47
-
48
-
49
-
50
-
51
-
52
-
53
-
54
-
55
-
56
-
57
-
58
-
59
-
60
-
61
-
62
-
63
-
64
-
65
-
66
-
67
-
68
-
69
-
70
-
71
-
72
-
73
-
74
-
75
-
76
-
77
-
78
-
79
-
80
-
81
-
82
-
83
-
84
-
85
-
86
-
87
-
88
-
89
-
90
-
91
-
92
-
93
-
94
-
95
-
96
-
97
-
98
-
99
-
100
-
101
-
102
-
103
-
104
-
105
-
106
-
107
-
108
-
109
-
110
-
111
-
112
-
113
-
114
-
115
-
116
-
117
-
118
-
119
-
120
-
121
-
122
-
123
-
124
-
125
-
126
-
127
-
128
-
129
-
130
-
131
-
132
-
133
-
134
-
135
-
136
-
137
-
138
-
139
-
140
-
141
-
142
-
143
-
144
-
145
-
146
-
147
-
148
-
149
-
150
-
151
-
152
-
153
-
154
-
155
-
156
-
157
-
158
-
159
-
160
-
161
-
162
-
163
-
164
-
165
-
166
-
167
-
 168
168 -
 169
169 -
 170
170 -
 171
171 -
 172
172 -
 173
173 -
 174
174 -
 175
175 -
 176
176 -
 177
177 -
 178
178 -
 179
179 -
 180
180 -
 181
181 -
 182
182
 |
 |

174 . TELUS 2011 ANNUAL REPORT
Q1 Q2 Q3 Q4 Q1 Q2 Q3 Q4 Q1 Q2 Q3 Q4 Q1 Q2 Q3 Q4 Q1 Q2 Q3 Q4
TSX (C$)
Common (T)
To ronto Stock Exchange
Non-voting (T. A)
Non-voting (TU)
New Yo rk Stock Exchange
75
60
45
30
NYSE (US$)
15
0
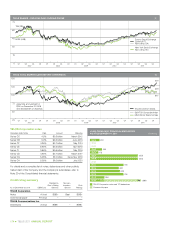
2007 2008 2009 2010 2011
TELUS SHARES – FIVE-YEAR DAILY CLOSING PRICES ($)
Q1 Q2 Q3 Q4 Q1 Q2 Q3 Q4 Q1 Q2 Q3 Q4 Q1 Q2 Q3 Q4 Q1 Q2 Q3 Q4
75
100
TELUS common shares
S&P/TSX Composite Index
MSCI World Te lecom Index
150
125
50
25
2007 2008 2009 2010 2011
Assuming an investment of
$100 on December 31, 2006
and reinvestment of dividends
$134
$109
$107
TELUS TOTAL SHAREHOLDER RETURN COMPARISON ($)
TELUS Corporation notes
Canadian dollar Notes Rate Amount Maturing
Series CC 4.5% $0.3 billion March 2012
Series CB 5.0% $0.3 billion June 2013
Series CF 4.95% $0.7 billion May 2014
Series CE 5.95% $0.5 billion April 2015
Series CI 3.65% $0.6 billion May 2016
Series CD 4.95% $0.7 billion March 2017
Series CG 5.05% $1.0 billion December 2019
Series CH 5.05% $1.0 billion July 2020
For details and a complete list of notes, debentures and other publicly
traded debt of the Company and the Company’s subsidiaries, refer to
Note 20 of the Consolidated financial statements.
Credit rating summary
Standard & Moody’s
Poor’s Rating Investors Fitch
As of December 31, 2011 DBRS Ltd. Services Service Ratings
TELUS Corporation
Notes A (low) BBB+ Baa1 BBB+
Commercial paper R-1 (low) – – –
TELUS Communications Inc.
Debentures A (low) BBB+ – BBB+
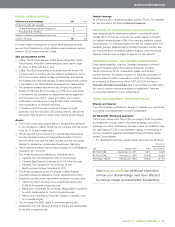
LONG-TERM DEBT PRINCIPAL MATURITIES
AS AT DECEMBER 31, 2011 ($ millions)
300 766
700
625
1,066
300
2025
2024
2023
2022
2021
2020
2019
2018
2017
2016 600
2015
2013
2014
2012
700
1,000
1,000
175
249
200
TELUS Corporation notes and TCI debentures
Commercial paper