Telus 2011 Annual Report Download - page 105
Download and view the complete annual report
Please find page 105 of the 2011 Telus annual report below. You can navigate through the pages in the report by either clicking on the pages listed below, or by using the keyword search tool below to find specific information within the annual report.-
 1
1 -
2
-
3
-
4
-
5
-
6
-
7
-
8
-
9
-
10
-
11
-
12
-
13
-
14
-
15
-
16
-
17
-
18
-
19
-
20
-
21
-
22
-
23
-
24
-
25
-
26
-
27
-
28
-
29
-
30
-
31
-
32
-
33
-
34
-
35
-
36
-
37
-
38
-
39
-
40
-
41
-
42
-
43
-
44
-
45
-
46
-
47
-
48
-
49
-
50
-
51
-
52
-
53
-
54
-
55
-
56
-
57
-
58
-
59
-
60
-
61
-
62
-
63
-
64
-
65
-
66
-
67
-
68
-
69
-
70
-
71
-
72
-
73
-
74
-
75
-
76
-
77
-
78
-
79
-
80
-
81
-
82
-
83
-
84
-
85
-
86
-
87
-
88
-
89
-
90
-
91
-
92
-
93
-
94
-
 95
95 -
 96
96 -
 97
97 -
 98
98 -
 99
99 -
 100
100 -
 101
101 -
 102
102 -
 103
103 -
 104
104 -
 105
105 -
 106
106 -
 107
107 -
 108
108 -
 109
109 -
 110
110 -
 111
111 -
 112
112 -
 113
113 -
 114
114 -
 115
115 -
116
-
117
-
118
-
119
-
120
-
121
-
122
-
123
-
124
-
125
-
126
-
127
-
128
-
129
-
130
-
131
-
132
-
133
-
134
-
135
-
136
-
137
-
138
-
139
-
140
-
141
-
142
-
143
-
144
-
145
-
146
-
147
-
148
-
149
-
150
-
151
-
152
-
153
-
154
-
155
-
156
-
157
-
158
-
159
-
160
-
161
-
162
-
163
-
164
-
165
-
166
-
167
-
168
-
169
-
170
-
171
-
172
-
173
-
174
-
175
-
176
-
177
-
178
-
179
-
180
-
181
-
182
 |
 |

TELUS 2011 ANNUAL REPORT . 101
MANAGEMENT’S DISCUSSION & ANALYSIS: 11
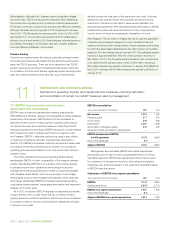
11.2 Free cash flow
Free cash flow does not have any standardized meaning prescribed
by IFRS-IASB and should not be considered an alternative to the
Consolidated statements of cash flows. TELUS reports free cash flow
because it is a key measure used by management to evaluate the
Company’s performance. Free cash flow excludes certain working capital
changes and other sources and uses of cash, as found in the Consoli-
dated statements of cash flows. Investors are cautioned that free cash
flow as reported by TELUS may not be comparable to free cash flow
reported by other companies, and differs from standardized free cash
flow defined by the CICA’s Canadian Performance Reporting Board.
Management’s definition of free cash flow provides an indication of how
much cash generated by operations is available after capital expendi-
tures, but before dividends, acquisitions, proceeds from divested assets
and changes in certain working capital items (such as trade receivables
and trade payables).
Free cash flow calculation
Years ended December 31 ($ millions) 2 0 11 2010
EBITDA (see Section 11.1) 3,778 3,650
Deduct Transactel gain (17) –
Restructuring costs net of cash payments (48) (24)
Items from the Consolidated statements of cash flows
Share-based compensation (12) (30)
Net employee defined benefit plans
expense (recovery) (32) (9)
Employer contributions to employee
defined benefit plans (298) (140)
Interest paid (378) (479)
Interest received 1 3
Income taxes refunded (paid), net (150) (311)
Capital expenditures (1,847) (1,721)
Free cash flow (management’s definition) 997 939
The Canadian Performance Reporting Board defined standardized
free cash flow to foster comparability of the measure between entities.
Standardized free cash flow is an indication of an entity’s capacity to
generate discretionary cash from operations, comprising cash flows from
operating activities less net capital expenditures and those dividends
that are more representative of interest costs. It does not necessarily
represent the cash flow in the period available for management to use
at its discretion, which may be affected by other sources and non-
discretionary uses of cash. The following reconciles management’s
definition of free cash flow with standardized free cash flow and Cash
provided by operating activities.
Free cash flow reconciliation
Years ended December 31 ($ millions) 2 0 11 2010
Cash provided by operating activities 2,550 2,670
Deduct stipulated dividends n/a n/a
Deduct capital expenditures (1,847) (1,721)
Proceeds from disposition of capital assets 4 1
Standardized free cash flow (CICA guideline) 707 950
Deduct proceeds from disposition of capital assets (4) (1)
Adjustments to reconcile to cash provided
by operating activities 294 (10)
Free cash flow (management’s definition) 997 939
11.3 Definitions of wireless operating indicators
These measures are industry metrics and are useful in assessing the
operating performance of a wireless company.
Average revenue per subscriber unit per month (ARPU) is calcu-
lated as Network revenue divided by the average number of subscriber
units on the network during the period and expressed as a rate per
month. Data ARPU is a component of ARPU, calculated on the same
basis for revenue derived from services such as text messaging,
mobile computing, personal digital assistance devices, Internet browser
activity and pay-per-use downloads.
Churn per month is calculated as the number of subscriber units
disconnected during a given period divided by the average number of
subscriber units on the network during the period, and expressed as
a rate per month. A prepaid subscriber is disconnected when the sub-
scriber has no usage for 90 days following expiry of the prepaid card.
Cost of acquisition (COA) consists of the total of handset subsidies,
commissions, and advertising and promotion expenses related to the
initial subscriber acquisition during a given period. As defined, COA
excludes costs to retain existing subscribers (retention spend).
COA per gross subscriber addition is calculated as cost of acquisition
divided by gross subscriber activations during the period.
Retention spend to Network revenue represents direct costs
associated with marketing and promotional efforts aimed at the retention
of the existing subscriber base divided by Network revenue.
11.4 Definitions of liquidity and capital resource measures
Earnings coverage is defined in the Canadian Securities
Administrators’ National Instrument 41-101 and related instruments,
calculated on a 12-month trailing basis.
Calculation of Earnings coverage
Years ended December 31
($ millions, except ratio) 2 0 11 2010
Net income attributable to Common Shares
and Non-Voting Shares 1,219 1,048
Income taxes 376 335
Gross interest expense (Note 8 of the
Audited consolidated financial statements) 389 527
Numerator 1,984 1,910
Denominator – Gross interest expense 389 527
Ratio (times) 5.1 3.6
The following measures do not have any standardized meaning
prescribed by IFRS-IASB and may not be comparable to similar
measures presented by other issuers.
Dividend payout ratio and dividend payout ratio of adjusted net
earnings: The basic measure is defined as the quarterly dividend
declared per Common Share and Non-Voting Share for the most recently
completed quarter, as reported in the Consolidated financial statements,
multiplied by four and divided by the sum of basic earnings per share
for the most recent four quarters for interim reporting periods (divided
by annual basic earnings per share for fiscal years). The target guideline
for the annual dividend payout ratio is on a prospective basis, rather
than on a trailing basis, and is 55 to 65% of sustainable net earnings.