Telus 2011 Annual Report Download - page 31
Download and view the complete annual report
Please find page 31 of the 2011 Telus annual report below. You can navigate through the pages in the report by either clicking on the pages listed below, or by using the keyword search tool below to find specific information within the annual report.-
 1
1 -
2
-
3
-
4
-
5
-
6
-
7
-
8
-
9
-
10
-
11
-
12
-
13
-
14
-
15
-
16
-
17
-
18
-
19
-
20
-
 21
21 -
 22
22 -
 23
23 -
 24
24 -
 25
25 -
 26
26 -
 27
27 -
 28
28 -
 29
29 -
 30
30 -
 31
31 -
 32
32 -
 33
33 -
 34
34 -
 35
35 -
 36
36 -
 37
37 -
 38
38 -
 39
39 -
 40
40 -
 41
41 -
42
-
43
-
44
-
45
-
46
-
47
-
48
-
49
-
50
-
51
-
52
-
53
-
54
-
55
-
56
-
57
-
58
-
59
-
60
-
61
-
62
-
63
-
64
-
65
-
66
-
67
-
68
-
69
-
70
-
71
-
72
-
73
-
74
-
75
-
76
-
77
-
78
-
79
-
80
-
81
-
82
-
83
-
84
-
85
-
86
-
87
-
88
-
89
-
90
-
91
-
92
-
93
-
94
-
95
-
96
-
97
-
98
-
99
-
100
-
101
-
102
-
103
-
104
-
105
-
106
-
107
-
108
-
109
-
110
-
111
-
112
-
113
-
114
-
115
-
116
-
117
-
118
-
119
-
120
-
121
-
122
-
123
-
124
-
125
-
126
-
127
-
128
-
129
-
130
-
131
-
132
-
133
-
134
-
135
-
136
-
137
-
138
-
139
-
140
-
141
-
142
-
143
-
144
-
145
-
146
-
147
-
148
-
149
-
150
-
151
-
152
-
153
-
154
-
155
-
156
-
157
-
158
-
159
-
160
-
161
-
162
-
163
-
164
-
165
-
166
-
167
-
168
-
169
-
170
-
171
-
172
-
173
-
174
-
175
-
176
-
177
-
178
-
179
-
180
-
181
-
182
 |
 |

TELUS 2011 ANNUAL REPORT . 27
2011 FINANCIAL AND OPERATING HIGHLIGHTS
growingperformance
($ in millions except per share amounts) 2 0 11 2010 % change
Income
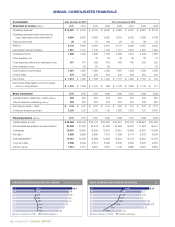
Operating revenues $ß10,397 $ß 9,792 6.2
EBITDA1 $ß 3,778 $ß 3,650 3.5
EBITDA margin (%) 36.3 37.3 –
Operating income $ß 1,968 $ß 1,909 3.1
Operating margin (%) 18.9 19.5 –
Net income attributable to common and non-voting shares $ß 1,219 $ß 1,048 16.3
Earnings per share (EPS) – basic $ß 3.76 $ß 3.27 15.0
EPS – basic, as adjusted2 $ß 3.66 $ß 3.33 9.9
Dividends declared per share $ß 2.205 $ß 2.00 10.3
Dividend payout ratio (%)1 62 64 –
Financial position
Total assets $ß19,931 $ß19,624 1.6
Net debt1 $ß 6,959 $ß 6,869 1.3
Total capitalization1 $ß14,461 $ß14,649 (1.3)
Net debt to total capitalization (%) 48.1 46.9 –
Return on common equity (%)3 15.5 13.8 –
Market capitalization of equity4 $ß18,274 $ß14,332 27.5
Liquidity and capital resources
Cash from operations $ß 2,550 $ß 2,670 (4.5)
Capital expenditures $ß 1,847 $ß 1,721 7.3
Free cash flow (before dividends)1 $ 997 $ 939 6.2
Net debt to EBITDA ratio1 1.8 1.8 –
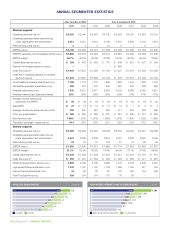
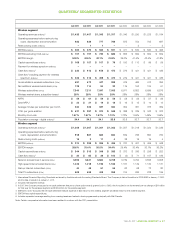
Wireless segment
External revenue $ß 5,462 $ß 5,012 9.0
EBITDA1 $ß 2,186 $ß 2,020 8.2
EBITDA margin on total revenue (%) 39.7 40.0 –
Wireline segment
External revenue $ß 4,935 $ß 4,780 3.2
EBITDA1 $ß 1,592 $ß 1,630 (2.3)
EBITDA margin on total revenue (%) 31.2 33.0 –
Customer connections (in thousands at December 31)
Wireless subscribers 7,340 6,971 5.3
Network access lines 3,593 3,739 (3.9)
Internet subscribers 1,286 1,229 4.6
Total TV subscribers 509 314 62.1
Total customer connections 12,728 12,253 3.9
1 For definitions of these measures, see Section 11 of Management’s discussion and analysis in this report.
2 Excludes in 2011 positive income tax-related adjustments of six cents per share and gain on acquisition of Transactel of four cents per share. Excludes in 2010
positive income tax-related adjustments of nine cents per share, offset by debt redemption losses of 12 cents per share and regulatory financing charges of
three cents per share.
3 Common share and non-voting share income divided by the average quarterly common share and non-voting share equity for the year.
4 Market value based on year-end closing share prices and shares outstanding.
Note: Certain comparative information has been restated to conform to the 2011 presentation.