Telus 2011 Annual Report Download - page 170
Download and view the complete annual report
Please find page 170 of the 2011 Telus annual report below. You can navigate through the pages in the report by either clicking on the pages listed below, or by using the keyword search tool below to find specific information within the annual report.-
 1
1 -
2
-
3
-
4
-
5
-
6
-
7
-
8
-
9
-
10
-
11
-
12
-
13
-
14
-
15
-
16
-
17
-
18
-
19
-
20
-
21
-
22
-
23
-
24
-
25
-
26
-
27
-
28
-
29
-
30
-
31
-
32
-
33
-
34
-
35
-
36
-
37
-
38
-
39
-
40
-
41
-
42
-
43
-
44
-
45
-
46
-
47
-
48
-
49
-
50
-
51
-
52
-
53
-
54
-
55
-
56
-
57
-
58
-
59
-
60
-
61
-
62
-
63
-
64
-
65
-
66
-
67
-
68
-
69
-
70
-
71
-
72
-
73
-
74
-
75
-
76
-
77
-
78
-
79
-
80
-
81
-
82
-
83
-
84
-
85
-
86
-
87
-
88
-
89
-
90
-
91
-
92
-
93
-
94
-
95
-
96
-
97
-
98
-
99
-
100
-
101
-
102
-
103
-
104
-
105
-
106
-
107
-
108
-
109
-
110
-
111
-
112
-
113
-
114
-
115
-
116
-
117
-
118
-
119
-
120
-
121
-
122
-
123
-
124
-
125
-
126
-
127
-
128
-
129
-
130
-
131
-
132
-
133
-
134
-
135
-
136
-
137
-
138
-
139
-
140
-
141
-
142
-
143
-
144
-
145
-
146
-
147
-
148
-
149
-
150
-
151
-
152
-
153
-
154
-
155
-
156
-
157
-
158
-
159
-
 160
160 -
 161
161 -
 162
162 -
 163
163 -
 164
164 -
 165
165 -
 166
166 -
 167
167 -
 168
168 -
 169
169 -
 170
170 -
 171
171 -
 172
172 -
 173
173 -
 174
174 -
 175
175 -
 176
176 -
 177
177 -
 178
178 -
 179
179 -
 180
180 -
181
-
182
 |
 |

166 . TELUS 2011 ANNUAL REPORT
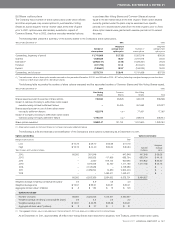
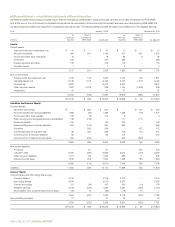
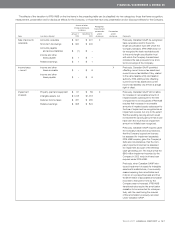
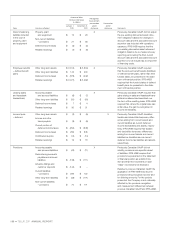
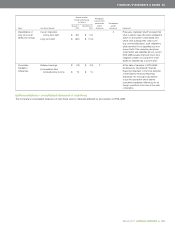
(d) Reconciliations – consolidated statements of financial position
Generally accepted accounting principles require that the Company’s shareholders’ equity previously reported at the date of transition to IFRS-IASB
and at the end of the most recently completed annual period be reconciled to those amounts that would have been reported applying IFRS-IASB; the
corresponding reconciliation is required for comparative periods as well. The following table provides the equity reconciliations for the requisite periods.
As at January 1, 2010 December 31, 2010
As Effect of As Effect of
previously transition to previously transition to
(millions) reported IFRS-IASB As adjusted reported IFRS-IASB As adjusted
Assets
Current assets
Cash and temporary investments, net $ 41 $ – $ 41 $ 17 $ – $ 17
Accounts receivable 694 501 1,195 917 401 1,318
Income and other taxes receivable 16 – 16 56 6 62
Inventories 270 – 270 283 – 283
Prepaid expenses and other 105 – 105 113 – 113
Derivative assets 1 – 1 4 – 4
1,127 501 1,628 1,390 407 1,797
Non-current assets
Property, plant and equipment, net 7,729 103 7,832 7,722 109 7,831
Intangible assets, net 5,148 1,018 6,166 5,134 1,018 6,152
Goodwill, net 3,572 – 3,572 3,572 – 3,572
Other long-term assets 1,602 (1,316) 286 1,744 (1,509) 235
Investments 41 – 41 37 – 37
18,092 (195) 17,897 18,209 (382) 17,827
$ß19,219 $ 306 $ß19,525 $ß19,599 $ 25 $ß19,624
Liabilities and Owners’ Equity
Current liabilities
Short-term borrowings $ – $ 500 $ 500 $ – $ 400 $ 400
Accounts payable and accrued liabilities 1,385 (49) 1,336 1,495 (18) 1,477
Income and other taxes payable 182 (8) 174 6 – 6
Restructuring accounts payable and accrued liabilities
135 (135) – 111 (111) –
Dividends payable 150 – 150 169 – 169
Advance billings and customer deposits 674 (144) 530 658 – 658
Provisions – 299 299 – 122 122
Current maturities of long-term debt 82 467 549 743 104 847
Current portion of derivative liabilities 62 – 62 419 – 419
Current portion of deferred income taxes 294 (294) – 348 (348) –
2,964 636 3,600 3,949 149 4,098
Non-current liabilities
Provisions – 91 91 – 204 204
Long-term debt 6,090 (467) 5,623 5,313 (104) 5,209
Other long-term liabilities 1,271 63 1,334 638 11 649
Deferred income taxes 1,319 203 1,522 1,498 185 1,683
8,680 (110) 8,570 7,449 296 7,745
Liabilities 11,644 526 12,170 11,398 445 11,843
Owners’ Equity
Common Share and Non-Voting Share equity
Common Shares 2,216 – 2,216 2,219 – 2,219
Non-Voting Shares 3,070 – 3,070 3,237 – 3,237
Contributed surplus 181 (14) 167 190 (14) 176
Retained earnings 2,159 (225) 1,934 2,551 (425) 2,126
Accumulated other comprehensive income (loss) (72) 19 (53) (18) 19 1
7,554 (220) 7,334 8,179 (420) 7,759
Non-controlling interests 21 – 21 22 – 22
7,575 (220) 7,355 8,201 (420) 7,781
$ß19,219 $ 306 $ß19,525 $ß19,599 $ 25 $ß19,624