Telus 2011 Annual Report Download - page 72
Download and view the complete annual report
Please find page 72 of the 2011 Telus annual report below. You can navigate through the pages in the report by either clicking on the pages listed below, or by using the keyword search tool below to find specific information within the annual report.-
 1
1 -
2
-
3
-
4
-
5
-
6
-
7
-
8
-
9
-
10
-
11
-
12
-
13
-
14
-
15
-
16
-
17
-
18
-
19
-
20
-
21
-
22
-
23
-
24
-
25
-
26
-
27
-
28
-
29
-
30
-
31
-
32
-
33
-
34
-
35
-
36
-
37
-
38
-
39
-
40
-
41
-
42
-
43
-
44
-
45
-
46
-
47
-
48
-
49
-
50
-
51
-
52
-
53
-
54
-
55
-
56
-
57
-
58
-
59
-
60
-
61
-
 62
62 -
 63
63 -
 64
64 -
 65
65 -
 66
66 -
 67
67 -
 68
68 -
 69
69 -
 70
70 -
 71
71 -
 72
72 -
 73
73 -
 74
74 -
 75
75 -
 76
76 -
 77
77 -
 78
78 -
 79
79 -
 80
80 -
 81
81 -
 82
82 -
83
-
84
-
85
-
86
-
87
-
88
-
89
-
90
-
91
-
92
-
93
-
94
-
95
-
96
-
97
-
98
-
99
-
100
-
101
-
102
-
103
-
104
-
105
-
106
-
107
-
108
-
109
-
110
-
111
-
112
-
113
-
114
-
115
-
116
-
117
-
118
-
119
-
120
-
121
-
122
-
123
-
124
-
125
-
126
-
127
-
128
-
129
-
130
-
131
-
132
-
133
-
134
-
135
-
136
-
137
-
138
-
139
-
140
-
141
-
142
-
143
-
144
-
145
-
146
-
147
-
148
-
149
-
150
-
151
-
152
-
153
-
154
-
155
-
156
-
157
-
158
-
159
-
160
-
161
-
162
-
163
-
164
-
165
-
166
-
167
-
168
-
169
-
170
-
171
-
172
-
173
-
174
-
175
-
176
-
177
-
178
-
179
-
180
-
181
-
182
 |
 |

68 . TELUS 2011 ANNUAL REPORT
The discussion in this section is qualified by the Caution regarding
forward-looking statements at the beginning of the MD&A.
The Company’s capital structure financial policies, financing plan
and results are described in Section 4.3. In the normal course, the
Company has generated annual cash flow from operations exceeding
the amounts of annual capital investment needed to support business
growth and reinvest in technology. In both 2011 and 2010, cash pro-
vided by operating activities exceeded cash used by investing activities.
As well, in 2010, long-term debt was reduced and the average term
to maturity of debt was extended through refinancing activities.
Summary information – Consolidated statements of cash flows
Years ended December 31 ($ millions) 2 0 11 2010 Change
Cash provided by operating activities 2,550 2,670 (4.5)%
Less:
Cash used by investing activities 1,968 1,731 13.7%
Cash used by financing activities 553 963 (42.6)%
Increase (decrease) in cash and
temporary investments, net 29 (24) –
Cash and temporary investments,
net, beginning of period 17 41 –
Cash and temporary investments,
net, end of period 46 17 170.6%
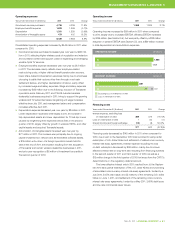
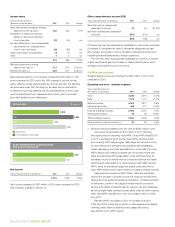
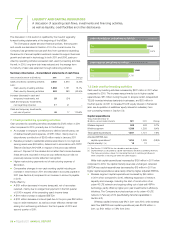
7.1 Cash provided by operating activities
Cash provided by operating activities decreased by $120 million in 2011
when compared to 2010, primarily due to the following:
.An increase in employer contributions to defined benefit plans, net
of defined benefit plans expense, of $181 million, mainly due to a
discretionary contribution of $200 million made in January 2011
.Rebates provided to residential wireline subscribers in non-high cost
serving areas were $53 million, determined in accordance with CRTC
Telecom Decision 2010-639, in respect of the price cap deferral
account. Payment of the rebates did not affect Net income because
these amounts recorded in the price cap deferral account did not
previously receive income statement recognition
.Higher restructuring payments net of restructuring expense of
$24 million
.Comparative changes in non-cash working capital including an
increase in inventories in 2011 and decrease in accounts payable in
2011 (see Section 6) compared to an increase in accounts payable
in 2010.
Partly offset by:
.A $161 million decrease in income taxes paid, net of recoveries
received, mainly due to a larger final payment in the first quarter
of 2010 in respect of the preceding year’s income taxes
.A $111 million increase in adjusted EBITDA
.A $101 million decrease in interest paid due to the prior year $52 million
loss on debt redemption, as well as a lower effective interest rate
arising from refinancing activities in the third quarter of 2010 and
second quarter of 2011.
10
09
CASH PROVIDED BY OPERATING ACTIVITIES ($ millions)
11 2,550
2,670
10
10
09
CASH USED BY INVESTING ACTIVITIES ($ millions)
11 1,968
1,731
10
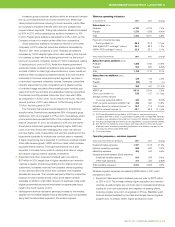
7.2 Cash used by investing activities
Cash used by investing activities increased by $237 million in 2011 when
compared to 2010. The increase was primarily due to higher capital
expenditures, $81 million during the year to acquire certain independent
TELUS-branded wireless dealership businesses, and $20 million in
the first quarter of 2011 to increase TELUS’ equity interest in Transactel
(also see Acquisition of additional equity interest in subsidiary from
non-controlling interest in Section 7.3).
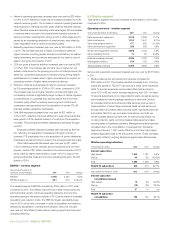
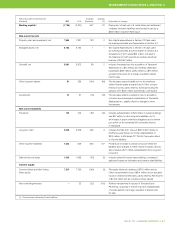
Capital expenditures
Years ended December 31
($ millions, except capital intensity) 2 0 11 2010 Change
Wireless segment 508 463 9.7%
Wireline segment 1,339 1,258 6.4%
Total capital expenditures 1,847 1,721 7.3%
Adjusted EBITDA less
capital expenditures(1) 1,914 1,929 (0.8)%
Capital intensity(2) (%) 18 18 –
(1) See Section 11.1 EBITDA for the calculation and description.
(2) Capital intensity is calculated as capital expenditures divided by operating revenues.
This measure provides a basis for comparing the level of capital expenditures to
other companies of varying size within the same industry.
While total capital expenditures increased by $126 million in 2011 when
compared to 2010, the capital intensity level was unchanged. Adjusted
EBITDA less capital expenditures decreased by $15 million in 2011 as
higher capital expenditures were nearly offset by higher adjusted EBITDA.
.Wireless segment capital expenditures increased by $45 million
in 2011 when compared to 2010, reflecting expansion of network
capacity and coverage, including the start of construction of an
urban 4G LTE network and ongoing rolling out of dual-cell HSPA+
technology, partly offset by higher prior year investments in efficiency
initiatives. The Company launched services on its urban 4G LTE
network in February 2012 (see Building national capabilities in
Section 2.2).
Wireless capital intensity was 9% in 2011 and 2010, while wireless
cash flow (EBITDA less capital expenditures) was $1,678 million in
2011, up $121 million or 7.8% from 2010.
7LIQUIDITY AND CAPITAL RESOURCES
A discussion of operating cash flows, investments and financing activities,
as well as liquidity, credit facilities and other disclosures