Telus 2011 Annual Report Download - page 62
Download and view the complete annual report
Please find page 62 of the 2011 Telus annual report below. You can navigate through the pages in the report by either clicking on the pages listed below, or by using the keyword search tool below to find specific information within the annual report.-
 1
1 -
2
-
3
-
4
-
5
-
6
-
7
-
8
-
9
-
10
-
11
-
12
-
13
-
14
-
15
-
16
-
17
-
18
-
19
-
20
-
21
-
22
-
23
-
24
-
25
-
26
-
27
-
28
-
29
-
30
-
31
-
32
-
33
-
34
-
35
-
36
-
37
-
38
-
39
-
40
-
41
-
42
-
43
-
44
-
45
-
46
-
47
-
48
-
49
-
50
-
51
-
 52
52 -
 53
53 -
 54
54 -
 55
55 -
 56
56 -
 57
57 -
 58
58 -
 59
59 -
 60
60 -
 61
61 -
 62
62 -
 63
63 -
 64
64 -
 65
65 -
 66
66 -
 67
67 -
 68
68 -
 69
69 -
 70
70 -
 71
71 -
 72
72 -
73
-
74
-
75
-
76
-
77
-
78
-
79
-
80
-
81
-
82
-
83
-
84
-
85
-
86
-
87
-
88
-
89
-
90
-
91
-
92
-
93
-
94
-
95
-
96
-
97
-
98
-
99
-
100
-
101
-
102
-
103
-
104
-
105
-
106
-
107
-
108
-
109
-
110
-
111
-
112
-
113
-
114
-
115
-
116
-
117
-
118
-
119
-
120
-
121
-
122
-
123
-
124
-
125
-
126
-
127
-
128
-
129
-
130
-
131
-
132
-
133
-
134
-
135
-
136
-
137
-
138
-
139
-
140
-
141
-
142
-
143
-
144
-
145
-
146
-
147
-
148
-
149
-
150
-
151
-
152
-
153
-
154
-
155
-
156
-
157
-
158
-
159
-
160
-
161
-
162
-
163
-
164
-
165
-
166
-
167
-
168
-
169
-
170
-
171
-
172
-
173
-
174
-
175
-
176
-
177
-
178
-
179
-
180
-
181
-
182
 |
 |

58 . TELUS 2011 ANNUAL REPORT
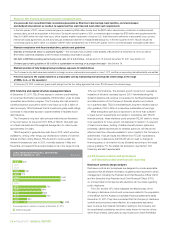
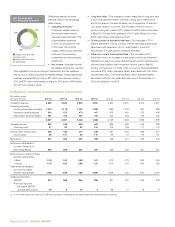
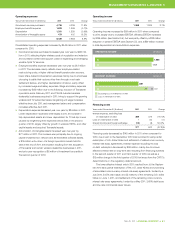
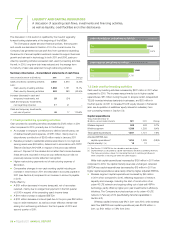
wireless voice and other
wireless data
wireline voice and other
wireline data
36%
16%
25%
2011 REVENUE MIX –
77% WIRELESS AND DATA
23%
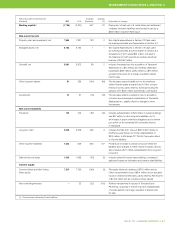
Differences among the three
calendar years in the preceding
table include:
.Operating revenues –
Combined wireless revenue
and wireline data revenue
represents
approximately 77%
of consolidated
revenues
in 2011, as compared to 74%
in 2010 and 71% in 2009.
Legacy wireline voice revenues
continue to be eroded by
competi
tion and technological
substitution.
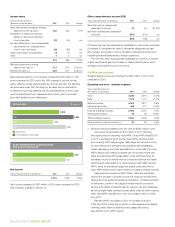
.Net income – Includes income
tax-related adjustments resulting
from legislated income tax changes, settlements and tax reassess-
ments for prior years, including any related interest. These adjustments
positively impacted Net income by $21 million (six cents per share) in
2011, by $30 million (nine cents per share) in 2010 and by $165 million
(52 cents per share) in 2009.
.Long-term debt – The increase in current maturities of long-term debt
in 2011 includes $300 million of Notes coming due in March 2012
and an increase in commercial paper, net of repayment of matured
U.S. dollar Notes in June 2011. The increase in the non-current
portion of long-term debt in 2011 reflects the $600 million Note issue
in May 2011 to help fund repayment of U.S. dollar Notes, net of the
$300 million Notes that became current.
.Current portion of derivative liabilities – The decrease in 2011
reflects settlement of cross currency interest rate swap agreements
associated with repayment of U.S. dollar Notes in June 2011
(see Section 7.3 Cash used by financing activities).
.Other non-current financial liabilities – The increase in 2011
is primarily due to an increase in pension and other post-retirement
liabilities, as a result of a lower defined benefit pension plan discount
rate and lower pension plan investment returns, partly offset by
funding. At December 31, 2009, other non-current financial liabilities
included a $721 million derivative liability associated with U.S. dollar
denominated debt. The remaining $404 million derivative liability
associated with the U.S. dollar debt was current at December 31,
2010, and settled in mid-2011.
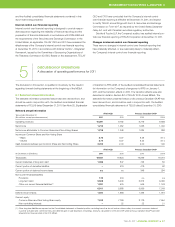
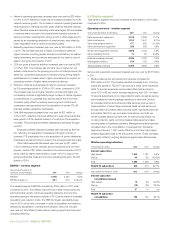
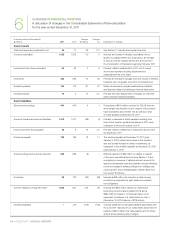
5.2 Summary of quarterly results and fourth quarter recap
($ in millions, except
per share amounts) 2011 Q4 2011 Q3 2011 Q2 2011 Q1 2010 Q4 2010 Q3 2010 Q2 2010 Q1
Operating revenues 2,690 2,622 2,554 2,531 2,554 2,461 2,400 2,377
Operating expenses
Goods and services purchased
1,316 1,178 1,134 1,098 1,235 1,036 997 968
Employee benefits expense 500 476 470 447 478 484 478 466
Depreciation and amortization 481 443 442 444 445 433 409 454
2,297 2,097 2,046 1,989 2,158 1,953 1,884 1,888
Operating income 393 525 508 542 396 508 516 489
Financing costs 87 92 94 104 105 185 117 115
Income before income taxes 306 433 414 438 291 323 399 374
Income taxes 69 107 90 110 65 72 97 101
Net income 237 326 324 328 226 251 302 273
Net income attributable to
Common Shares and
Non-Voting Shares 246 325 321 327 225 250 301 272
Net Income per Common Share
and Non-Voting Share
– Basic 0.76 1.00 0.99 1.01 0.70 0.78 0.94 0.85
– Diluted 0.75 1.00 0.98 1.00 0.70 0.78 0.94 0.85
Cash dividends declared
per Common Share
and Non-Voting Share 0.58 0.55 0.55 0.525 0.525 0.50 0.50 0.475
Additional information
EBITDA(1) 874 968 950 986 841 941 925 943
Restructuring costs
included in EBITDA
and Operating income 16 3 12 4 38 17 19 6
(1) A non-GAAP measure (see Section 11.1 EBITDA). Equivalent to Operating income before depreciation and amortization expenses.