Telus 2011 Annual Report Download - page 41
Download and view the complete annual report
Please find page 41 of the 2011 Telus annual report below. You can navigate through the pages in the report by either clicking on the pages listed below, or by using the keyword search tool below to find specific information within the annual report.-
 1
1 -
2
-
3
-
4
-
5
-
6
-
7
-
8
-
9
-
10
-
11
-
12
-
13
-
14
-
15
-
16
-
17
-
18
-
19
-
20
-
21
-
22
-
23
-
24
-
25
-
26
-
27
-
28
-
29
-
30
-
 31
31 -
 32
32 -
 33
33 -
 34
34 -
 35
35 -
 36
36 -
 37
37 -
 38
38 -
 39
39 -
 40
40 -
 41
41 -
 42
42 -
 43
43 -
 44
44 -
 45
45 -
 46
46 -
 47
47 -
 48
48 -
 49
49 -
 50
50 -
 51
51 -
52
-
53
-
54
-
55
-
56
-
57
-
58
-
59
-
60
-
61
-
62
-
63
-
64
-
65
-
66
-
67
-
68
-
69
-
70
-
71
-
72
-
73
-
74
-
75
-
76
-
77
-
78
-
79
-
80
-
81
-
82
-
83
-
84
-
85
-
86
-
87
-
88
-
89
-
90
-
91
-
92
-
93
-
94
-
95
-
96
-
97
-
98
-
99
-
100
-
101
-
102
-
103
-
104
-
105
-
106
-
107
-
108
-
109
-
110
-
111
-
112
-
113
-
114
-
115
-
116
-
117
-
118
-
119
-
120
-
121
-
122
-
123
-
124
-
125
-
126
-
127
-
128
-
129
-
130
-
131
-
132
-
133
-
134
-
135
-
136
-
137
-
138
-
139
-
140
-
141
-
142
-
143
-
144
-
145
-
146
-
147
-
148
-
149
-
150
-
151
-
152
-
153
-
154
-
155
-
156
-
157
-
158
-
159
-
160
-
161
-
162
-
163
-
164
-
165
-
166
-
167
-
168
-
169
-
170
-
171
-
172
-
173
-
174
-
175
-
176
-
177
-
178
-
179
-
180
-
181
-
182
 |
 |

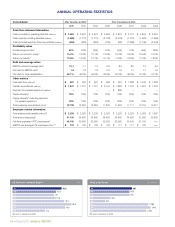
TELUS 2011 ANNUAL REPORT . 37
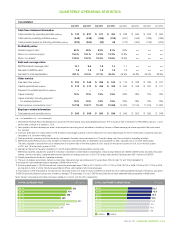
QUARTERLY SEGMENTED STATISTICS
Q4 2011 Q3 2011 Q2 2011 Q1 2011 Q4 2010 Q3 2010 Q2 2010 Q1 2010
Wireless segment
Operating revenues (millions)2 $ß1,433 $ß1,407 $ß1,343 $ß1,317 $ß1,346 $ß1,290 $ß1,225 $ß1,184
Operating expenses before restructuring
costs, depreciation and amortization 933 836 777 766 875 754 705 687
Restructuring costs (millions) – 1 1 – – 2 – 2
EBITDA (millions) $ 500 $ 570 $ 565 $ 551 $ 471 $ 534 $ 520 $ 495
EBITDA excluding COA (millions) $ 707 $ 757 $ 730 $ 686 $ 655 $ 692 $ 662 $ 609
EBITDA margin 34.9% 40.5% 42.1% 41.8% 35.0% 41.4% 42.4% 41.8%
Capital expenditures (millions) $ 168 $ 157 $ 107 $ 76 $ 192 $ 113 $ 99 $ 59
Payment for wireless spectrum (millions) – – – – – – – –
Cash flow (millions)5 $ 332 $ 413 $ 458 $ 475 $ 279 $ 421 $ 421 $ 436
Cash flow5 including payment for wireless
spectrum (millions) $ 332 $ 413 $ 458 $ 475 $ 279 $ 421 $ 421 $ 436
Gross additions wireless subscribers (000s) 491 472 447 388 475 466 413 356
Net additions wireless subscribers (000s) 129 114 94 32 119 153 124 51
Wireless subscribers (000s) 7,340 7,211 7,097 7,003 6,971 6,852 6,699 6,575
Wireless market share, subscriber-based 28% 28% 28% 28% 28% 28% 28% 28%
ARPU $ 59 $ 61 $ 59 $ 58 $ 58 $ 59 $ 57 $ 56
Data ARPU $ 22 $ 21 $ 19 $ 18 $ 16 $ 15 $ 14 $ 13
Average minutes per subscriber per month 334 332 337 324 352 361 373 359
COA, per gross addition $ 421 $ 397 $ 370 $ 348 $ 388 $ 339 $ 342 $ 322
Monthly churn rate 1.67% 1.67% 1.67% 1.70% 1.72% 1.54% 1.45% 1.55%
Population coverage – digital (millions)6 34.4 34.3 34.1 33.8 33.8 33.7 33.7 33.7
Wireline segment
Operating revenues (millions)2 $ß1,308 $ß1,267 $ß1,261 $ß1,263 $ß1,257 $ß1,218 $ß1,224 $ß1,236
Operating expenses before restructuring
costs, depreciation and amortization 918 867 865 824 849 796 800 784
Restructuring costs (millions) 16 2 11 4 38 15 19 4
EBITDA (millions) $ 374 $ 398 $ 385 $ 435 $ 370 $ 407 $ 405 $ 448
EBITDA margin 28.6% 31.4% 30.5% 34.4% 29.4% 33.4% 33.1% 36.2%
Capital expenditures (millions) $ 344 $ 313 $ 349 $ 333 $ 372 $ 336 $ 298 $ 252
Cash flow (millions)5 $ 30 $ 85 $ 36 $ 102 $ß (2) $ 71 $ 107 $ 196
Network access lines in service (000s) 3,593 3,641 3,684 3,708 3,739 3,794 3,845 3,908
High-speed Internet subscribers (000s) 1,242 1,218 1,196 1,183 1,167 1,149 1,134 1,131
Dial-up Internet subscribers (000s) 44 48 51 56 62 68 73 80
Total TV subscribers (000s) 509 453 403 358 314 266 228 199
1 International Financial Reporting Standards as issued by the International Accounting Standards Board. The Company’s date of transition to IFRS-IASB is January 1, 2010,
and its date of adoption is January 1, 2011.
2 Includes intersegment revenue.
3
In 2007, the Company introduced a net-cash settlement feature for share option awards granted prior to 2005, which resulted in an incremental pre-tax charge of $24 million
for that year for the wireless segment and $145 million for the wireline segment.
4 EBITDA for 2007 excludes the net-cash settlement feature expense of $24 million for the wireless segment and $145 million for the wireline segment.
5 EBITDA less capital expenditures.
6 Includes expanded coverage resulting from roaming/resale and network sharing agreements principally with Bell Canada.
Note: Certain comparative information has been restated to conform with the 2011 presentation.