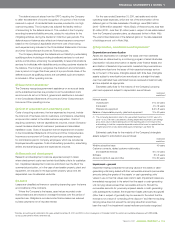
Telus 2011 Annual Report Download - page 110
Download and view the complete annual report
Please find page 110 of the 2011 Telus annual report below. You can navigate through the pages in the report by either clicking on the pages listed below, or by using the keyword search tool below to find specific information within the annual report.
106 . TELUS 2011 ANNUAL REPORT
Years ended December 31 (millions except per share amounts) Note 2 0 11 2010
(adjusted –
Note 25(c))
Operating Revenues
Service $ßß 9,606 $ßß 9,131
Equipment 719 611
10,325 9,742
Other operating income 6 72 50
10,397 9,792
Operating Expenses
Goods and services purchased 4,726 4,236
Employee benefits expense 7 1,893 1,906
Depreciation 1,331 1,339
Amortization of intangible assets 479 402
8,429 7,883
Operating Income 1,968 1,909
Financing costs 8 377 522
Income Before Income Taxes 1,591 1,387
Income taxes 9 376 335
Net Income 1,215 1,052
Other Comprehensive Income 10
Items that may subsequently be reclassified to income
Change in unrealized fair value of derivatives designated as cash flow hedges 6 54
Foreign currency translation adjustment arising from translating
financial statements of foreign operations 4 –
10 54
Item never subsequently reclassified to income
Employee defined benefit plans actuarial gains (losses) (851) (214)
(841) (160)
Comprehensive Income $ 374 $ 892
Net Income (Loss) Attributable to:
Common Shares and Non-Voting Shares $ß 1,219 $ß 1,048
Non-controlling interests (4) 4
$ß 1,215 $ß 1,052
Total Comprehensive Income (Loss) Attributable to:
Common Shares and Non-Voting Shares $ 378 $ 888
Non-controlling interests (4) 4
$ 374 $ 892
Net Income Per Common Share and Non-Voting Share 11
Basic $ß 3.76 $ß 3.27
Diluted $ß 3.74 $ß 3.27
Dividends Declared Per Common Share and Non-Voting Share 12 $ß 2.205 $ß 2.000
Total Weighted Average Common Shares and Non-Voting Shares Outstanding
Basic 324 320
Diluted 326 321
The accompanying notes are an integral part of these consolidated financial statements.
CONSOLIDATED STATEMENTS OF INCOME
AND OTHER COMPREHENSIVE INCOME


