Telus 2011 Annual Report Download - page 161
Download and view the complete annual report
Please find page 161 of the 2011 Telus annual report below. You can navigate through the pages in the report by either clicking on the pages listed below, or by using the keyword search tool below to find specific information within the annual report.-
 1
1 -
2
-
3
-
4
-
5
-
6
-
7
-
8
-
9
-
10
-
11
-
12
-
13
-
14
-
15
-
16
-
17
-
18
-
19
-
20
-
21
-
22
-
23
-
24
-
25
-
26
-
27
-
28
-
29
-
30
-
31
-
32
-
33
-
34
-
35
-
36
-
37
-
38
-
39
-
40
-
41
-
42
-
43
-
44
-
45
-
46
-
47
-
48
-
49
-
50
-
51
-
52
-
53
-
54
-
55
-
56
-
57
-
58
-
59
-
60
-
61
-
62
-
63
-
64
-
65
-
66
-
67
-
68
-
69
-
70
-
71
-
72
-
73
-
74
-
75
-
76
-
77
-
78
-
79
-
80
-
81
-
82
-
83
-
84
-
85
-
86
-
87
-
88
-
89
-
90
-
91
-
92
-
93
-
94
-
95
-
96
-
97
-
98
-
99
-
100
-
101
-
102
-
103
-
104
-
105
-
106
-
107
-
108
-
109
-
110
-
111
-
112
-
113
-
114
-
115
-
116
-
117
-
118
-
119
-
120
-
121
-
122
-
123
-
124
-
125
-
126
-
127
-
128
-
129
-
130
-
131
-
132
-
133
-
134
-
135
-
136
-
137
-
138
-
139
-
140
-
141
-
142
-
143
-
144
-
145
-
146
-
147
-
148
-
149
-
150
-
 151
151 -
 152
152 -
 153
153 -
 154
154 -
 155
155 -
 156
156 -
 157
157 -
 158
158 -
 159
159 -
 160
160 -
 161
161 -
 162
162 -
 163
163 -
 164
164 -
 165
165 -
 166
166 -
 167
167 -
 168
168 -
 169
169 -
 170
170 -
 171
171 -
172
-
173
-
174
-
175
-
176
-
177
-
178
-
179
-
180
-
181
-
182
 |
 |

TELUS 2011 ANNUAL REPORT . 157
FINANCIAL STATEMENTS & NOTES: 21
(b) Share option plans
The Company has a number of share option plans under which officers
and other employees may receive options to purchase Non-Voting
Shares at a price equal to the fair market value at the time of grant;
prior to 2001, options were also similarly awarded in respect of
Common Shares. Prior to 2002, directors were also awarded options
to purchase Non-Voting Shares and Common Shares at a price
equal to the fair market value at the time of grant. Share option awards
currently granted under the plans may be exercised over specific
periods not to exceed seven years from the time of grant; prior to 2003,
share option awards were granted with exercise periods not to exceed
ten years.
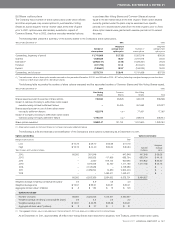
The following table presents a summary of the activity related to the Company’s share option plans.
Years ended December 31 2 0 11 2010
Weighted Weighted
Number of average share Number of average share
share options option price share options option price
Outstanding, beginning of period 11,741,666 $ß37.83 11,057,916 $ß38.08
Granted 1,522,639 46.67 2,787,876 33.00
Exercised(1) (2,963,147) 37.56 (1,329,351) 29.23
Forfeited (617,796) 37.41 (614,941) 39.55
Expired (109,661) 32.57 (159,834) 35.80
Outstanding, end of period 9,573,701 $ß39.41 11,741,666 $ß37.83
(1) The total intrinsic value of share option awards exercised for the year ended December 31, 2011, was $35 million (2010 – $17 million) (reflecting a weighted average price at the dates
of exercise of $49.48 per share (2010 – $41.88 per share)).
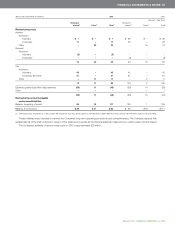
The following table reconciles the number of share options exercised and the associated number of Common Shares and Non-Voting Shares issued.
Years ended December 31 2 0 11 2010
Non-Voting Common Non-Voting
Shares Shares Shares Total
Shares issued pursuant to exercise of share options 745,340 96,526 440,073 536,599
Impact of optionee choosing to settle share option award
exercises using net-cash settlement feature – 25,225 451,652 476,877
Shares issued pursuant to use of share option award
net-equity settlement feature 422,076 n.a.(1) 77,061 77,061
Impact of Company choosing to settle share option award
exercises using net-equity settlement feature 1,795,731 n.a.(1) 238,814 238,814
Share options exercised 2,963,147 121,751 1,207,600 1,329,351
(1) Share option awards for Common Shares do not have a net-equity settlement feature.
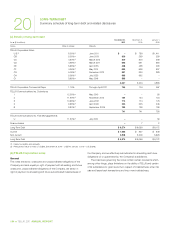
The following is a life and exercise price stratification of the Company’s share options outstanding as at December 31, 2011.
Options outstanding Options exercisable
Range of option prices Total
Low $ß10.75 $ß29.70 $ß44.66 $ß10.75 Weighted
High $ß16.15 $ß44.20 $ß64.64 $ß64.64 Number average
Year of expiry and number of shares of shares price
2012 66,300 381,546 – 447,846 447,846 $ß36.03
2013 – 565,825 117,969 683,794 683,794 $ß44.18
2014 – 2,550 918,142 920,692 915,822 $ß56.50
2015 – 1,375,005 42,160 1,417,165 1,417,165 $ß43.76
2016 – 2,108,589 – 2,108,589 – $ –
2017 – 2,489,824 12,380 2,502,204 – $ –
2018 – – 1,493,411 1,493,411 – $ –
66,300 6,923,339 2,584,062 9,573,701 3,464,627
Weighted average remaining contractual life (years) 0.9 3.9 4.5 4.0
Weighted average price $ß15.91 $ß35.57 $ß50.31 $ß39.41
Aggregate intrinsic value(1) (millions) $ 3 $ 132 $ 13 $ 148
Options exercisable
Number of shares 66,300 2,324,926 1,073,401 3,464,627
Weighted average remaining contractual life (years) 0.9 2.2 2.2 2.2
Weighted average price $ß15.91 $ß42.85 $ß55.36 $ß46.21
Aggregate intrinsic value(1) (millions) $ 3 $ 27 $ 1 $ 31
(1) The aggregate intrinsic value is calculated upon the December 31, 2011, per share price of $54.64 for Non-Voting Shares.
As at December 31, 2011, approximately 28 million Non-Voting Shares were reserved for issuance, from Treasury, under the share option plans.