Telus 2011 Annual Report Download - page 74
Download and view the complete annual report
Please find page 74 of the 2011 Telus annual report below. You can navigate through the pages in the report by either clicking on the pages listed below, or by using the keyword search tool below to find specific information within the annual report.-
 1
1 -
2
-
3
-
4
-
5
-
6
-
7
-
8
-
9
-
10
-
11
-
12
-
13
-
14
-
15
-
16
-
17
-
18
-
19
-
20
-
21
-
22
-
23
-
24
-
25
-
26
-
27
-
28
-
29
-
30
-
31
-
32
-
33
-
34
-
35
-
36
-
37
-
38
-
39
-
40
-
41
-
42
-
43
-
44
-
45
-
46
-
47
-
48
-
49
-
50
-
51
-
52
-
53
-
54
-
55
-
56
-
57
-
58
-
59
-
60
-
61
-
62
-
63
-
 64
64 -
 65
65 -
 66
66 -
 67
67 -
 68
68 -
 69
69 -
 70
70 -
 71
71 -
 72
72 -
 73
73 -
 74
74 -
 75
75 -
 76
76 -
 77
77 -
 78
78 -
 79
79 -
 80
80 -
 81
81 -
 82
82 -
 83
83 -
 84
84 -
85
-
86
-
87
-
88
-
89
-
90
-
91
-
92
-
93
-
94
-
95
-
96
-
97
-
98
-
99
-
100
-
101
-
102
-
103
-
104
-
105
-
106
-
107
-
108
-
109
-
110
-
111
-
112
-
113
-
114
-
115
-
116
-
117
-
118
-
119
-
120
-
121
-
122
-
123
-
124
-
125
-
126
-
127
-
128
-
129
-
130
-
131
-
132
-
133
-
134
-
135
-
136
-
137
-
138
-
139
-
140
-
141
-
142
-
143
-
144
-
145
-
146
-
147
-
148
-
149
-
150
-
151
-
152
-
153
-
154
-
155
-
156
-
157
-
158
-
159
-
160
-
161
-
162
-
163
-
164
-
165
-
166
-
167
-
168
-
169
-
170
-
171
-
172
-
173
-
174
-
175
-
176
-
177
-
178
-
179
-
180
-
181
-
182
 |
 |

70 . TELUS 2011 ANNUAL REPORT
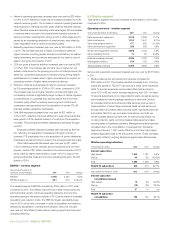
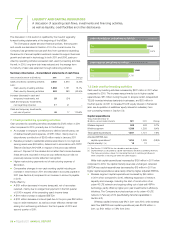
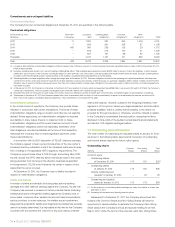
7.4 Liquidity and capital resource measures
Net debt as at December 31, 2011, increased by $90 million from one
year earlier mainly due to an increase in commercial paper to help fund
the discretionary $200 million contribution to defined benefit pension
plans in January 2011 and certain acquisitions in the first half of 2011,
partly offset by repayment of matured U.S. dollar Notes and settlement
of the associated derivative liability in the second quarter. Total capital-
ization at December 31, 2011, decreased by $188 million from one year
earlier, mainly due to a decrease in equity (see Section 6).
The proportion of debt on a fixed-rate basis was 83% at December 31,
2011, down from 93% at the beginning of the year due to the commer-
cial paper issued to help fund a discretionary contribution to defined
benefit pension plans and acquisitions, as well as repayment of matured
Notes on June 1 and settlement of related cross currency interest rate
swap agreements, partly offset by a fixed-rate $600 million five-year Note
issue in May. The average term to maturity of debt was 5.6 years at
December 31, 2011, down from 5.7 years at the beginning of the year
due mainly to the passage of time.
Liquidity and capital resource measures
As at, or years ended, December 31 2 0 11 2010 Change
Components of debt and
coverage ratios(1) ($ millions)
Net debt 6,959 6,869 90
Total capitalization – book value(2) 14,461 14,649 (188)
EBITDA – excluding
restructuring costs 3,813 3,730 83
Net interest cost 377 522 (145)
Debt ratios
Fixed-rate debt as a proportion
of total indebtedness (%) 83 93 (10) pts.
Average term to maturity
of debt (years) 5.6 5.7 (0.1)
Net debt to total
capitalization(1)(2) (%) 48.1 46.9 1.2 pts.
Net debt to EBITDA – excluding
restructuring costs(1) 1.8 1.8 –
Coverage ratios(1) (times)
Earnings coverage 5.1 3.6 1.5
EBITDA – excluding restructuring
costs interest coverage 10.1 7.1 3.0
Other 12-month trailing measures
Free cash flow(3) ($ millions) 997 939 58
Dividend payout ratio of
adjusted net earnings(1) (%) 64 64 –
Dividend payout ratio(1) (%) 62 64 (2) pts.
(1) See Section 11.4 Definitions of liquidity and capital resource measures.
(2) Figures for 2010 have been restated. See Total capitalization in Section 11.4.
(3) See Section 11.2 Free cash flow for the definition.
The earnings coverage ratio for 2011 was 5.1 times, up from 3.6 times
in 2010. Lower gross interest expenses increased the ratio by 1.3, while
higher income before gross interest and income taxes increased the ratio
by 0.2. The EBITDA – excluding restructuring costs interest coverage
ratio for 2011 was 10.1 times, up from 7.1 times in 2010. Lower net interest
costs increased the ratio by 2.7, while higher EBITDA before restructuring
costs increased the ratio by 0.3.
Free cash flow was $997 million in 2011, up $58 million from 2010,
mainly due to higher EBITDA and lower paid interest and income taxes,
partly offset by higher capital expenditures and increased contributions
to defined benefit plans, including a discretionary $200 million contribution
in January 2011.
The Company’s strategy is to maintain the financial policies and
guidelines set out below. The Company believes that these measures
are currently at the optimal level and by maintaining credit ratings in
the range of BBB+ to A–, or the equivalent, are expected to continue
to provide reasonable access to capital markets.
TELUS long-term financial policies and guidelines
.Net debt to EBITDA – excluding restructuring costs of 1.5 to 2.0 times
The ratio was 1.8 times at December 31, 2011, unchanged from one
year earlier. A small increase in Net debt was offset by higher EBITDA
before restructuring costs.
.Dividend payout ratio target guideline of 55 to 65% of sustainable
net earnings
The target guideline is on a prospective basis, rather than on a trailing
basis. The payout ratio is seen as appropriate to the Company’s
current expectations for earnings, cash flow and capital expenditure
investments.
10
09
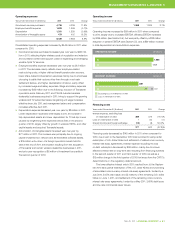
NET DEBT TO EBITDA
11 1.8
1. 8
10
EBITDA excludes restructuring costs.
10
09
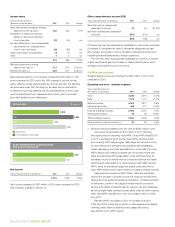
EBITDA (EXCLUDING RESTRUCTURING COSTS)
INTEREST COVERAGE
11 10.1
7.1
10
Excluding $52 million loss on debt redemption in 2010, the ratio was 7. 8 times.