Telus 2011 Annual Report Download - page 45
Download and view the complete annual report
Please find page 45 of the 2011 Telus annual report below. You can navigate through the pages in the report by either clicking on the pages listed below, or by using the keyword search tool below to find specific information within the annual report.-
 1
1 -
2
-
3
-
4
-
5
-
6
-
7
-
8
-
9
-
10
-
11
-
12
-
13
-
14
-
15
-
16
-
17
-
18
-
19
-
20
-
21
-
22
-
23
-
24
-
25
-
26
-
27
-
28
-
29
-
30
-
31
-
32
-
33
-
34
-
 35
35 -
 36
36 -
 37
37 -
 38
38 -
 39
39 -
 40
40 -
 41
41 -
 42
42 -
 43
43 -
 44
44 -
 45
45 -
 46
46 -
 47
47 -
 48
48 -
 49
49 -
 50
50 -
 51
51 -
 52
52 -
 53
53 -
 54
54 -
 55
55 -
56
-
57
-
58
-
59
-
60
-
61
-
62
-
63
-
64
-
65
-
66
-
67
-
68
-
69
-
70
-
71
-
72
-
73
-
74
-
75
-
76
-
77
-
78
-
79
-
80
-
81
-
82
-
83
-
84
-
85
-
86
-
87
-
88
-
89
-
90
-
91
-
92
-
93
-
94
-
95
-
96
-
97
-
98
-
99
-
100
-
101
-
102
-
103
-
104
-
105
-
106
-
107
-
108
-
109
-
110
-
111
-
112
-
113
-
114
-
115
-
116
-
117
-
118
-
119
-
120
-
121
-
122
-
123
-
124
-
125
-
126
-
127
-
128
-
129
-
130
-
131
-
132
-
133
-
134
-
135
-
136
-
137
-
138
-
139
-
140
-
141
-
142
-
143
-
144
-
145
-
146
-
147
-
148
-
149
-
150
-
151
-
152
-
153
-
154
-
155
-
156
-
157
-
158
-
159
-
160
-
161
-
162
-
163
-
164
-
165
-
166
-
167
-
168
-
169
-
170
-
171
-
172
-
173
-
174
-
175
-
176
-
177
-
178
-
179
-
180
-
181
-
182
 |
 |

TELUS 2011 ANNUAL REPORT . 41
MANAGEMENT’S DISCUSSION & ANALYSIS: 1
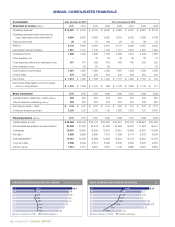
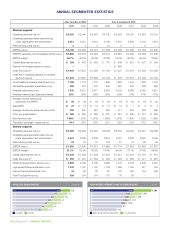
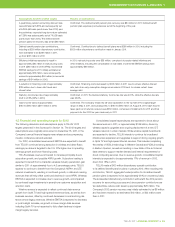
Operating highlights
.Consolidated Operating revenues increased by $605 million in
2011 when compared to 2010, surpassing $10 billion for the first time
in 2011.
Service and equipment revenues increased by $583 million in 2011
when compared to 2010. Approximately 67% of the increase was
due to the growth in wireless network revenue, which increased by
8.5% driven by growth in the number of subscribers, growth in data
ARPU related to accelerated smartphone adoption, and increased
roaming revenues.
The remaining increase was due to: (i) growth
in wireline data reve
nues resulting from TV and high-speed Internet
subscriber growth and rate increases, increased equipment sales and
revenues from implemen tation of recent large enterprise customer
deals, as well as revenues from operations of Transactel (Barbados)
Inc. consolidated since February 1, 2011 (see Partnering, acquiring
and divesting in Section 2.2); and (ii) increased wireless equipment
revenues driven
by higher gross subscriber additions, increased
retention volumes, device upgrade revenues, a larger proportion of
higher-priced smart phones in the sales mix, as well as current year
tablet sales. Partly offsetting growth in wireline data revenue is the
continued decline in wireline legacy voice revenues as a result of
competition and substitution to data and wireless services. Partly
offsetting growth in wireless data revenue is the year-over-year
decline in wireless voice revenue due to lower usage as customers
move towards using more texting and data services and reducing
voice calls, as well as competitive pricing.
Other operating income, presented as a separate component
of revenues, increased by $22 million in 2011. The increase includes
a $17 million non-cash gain on Transactel (Barbados) Inc. in 2011;
the gain reflects a re-measurement at fair value when TELUS exer-
cised its purchased call option and asserted control. Transactel
operates call centres in Central America (see Partnering and acquiring
in Section 2.2). The increase also includes higher recoveries of
employee costs under eligible government-sponsored employment
programs, and a drawdown of the price cap deferral account for
provisioning of broadband Internet service to a number of qualifying
rural and remote communities, partly offset by lower portable
subsidy revenues.
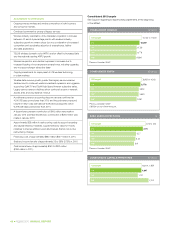
Consolidated Operating revenues excluding the non-cash
Transactel gain increased by $588 million or 6.0% in 2011 when
compared to 2010.
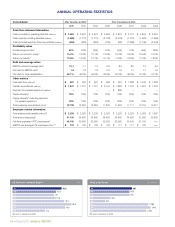
.Subscriber connections increased by 475,000 during 2011
(378,000 in 2010), as a result of 7.4% growth in wireless postpaid
subscribers, 62% growth in TELUS TV subscribers, and a 4.6%
increase in total Internet subscriptions, partly offset by a 6.9%
decrease in wireless prepaid subscribers and a 3.9% decrease in
total network access lines (NALs). Residential NAL losses in 2011
improved by 46,000 as a result of the positive effect of bundled
service offers including Optik TV and Optik High Speed Internet
services following their market launch in June 2010. Business NAL
losses improved by 35,000 in 2011 as additions of wholesale lines
partly offset the effects of increased competition in the small and
medium business market and the ongoing conversion of voice lines
to more efficient IP services. Wireline total subscriber connections
increased by 107,000 in 2011 – the first such wireline increase
since 2004.
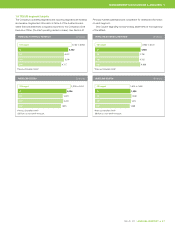
The blended monthly wireless subscriber churn rate was 1.68%
in 2011, up from 1.57% in 2010 due to the loss of a federal govern-
ment wireless service contract to a low-priced bid from an incumbent
competitor (a loss of approximately 77,000 subscribers, which added
11 basis points of churn in 2011).
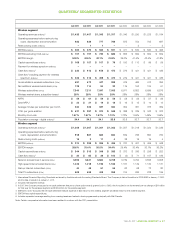
Wireless blended ARPU was $59.10 in 2011, up 2.5% from the
same period in 2010. The increase reflects the 38% growth in data
ARPU resulting from increased use of data services and a higher
penetration of smartphones, as well as increased roaming, partly
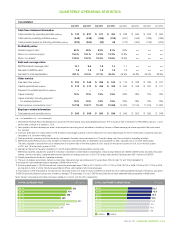
offset by lower voice pricing and declining minutes of use. Quarterly
blended ARPU has increased year over year for five consecutive
quarters: 1.0% (Q4 2011), 3.0% (Q3 2011), 2.5% (Q2 2011), 2.7%
(Q1 2011) and 1.9% (Q4 2010). Prior to the fourth quarter of 2010,
blended ARPU had been declining since mid-2007.
.Operating income increased by $59 million in 2011 when com-
pared to 2010. The increase in 2011 was mainly due to a $128 million
increase in EBITDA that was partly offset by higher amortization
expenses. Wireless EBITDA increased by $166 million, driven by 8.5%
growth in network revenue that was partly offset by higher costs of
sub scriber acquisition and retention. Wireline EBITDA decreased
by $38 million as growth in data services, lower restructuring costs
and the $17 million Transactel gain were more than offset by higher
content and support costs for the growing Optik TV service and
ongoing declines in higher margin legacy voice services.
TELUS’ adjusted EBITDA for 2011, which excludes the $17 million
Transactel gain, increased by $111 million when compared to 2010.
The adjusted EBITDA margin decreased by 1.1 percentage points
due to margin pressures in both segments.
.Income before income taxes increased by $204 million in 2011
due to lower Financing costs and increased Operating income.
Financing costs decreased by $145 million year over year primarily
due to lower effective interest rates resulting from $1.6 billion of
refinancing in the second quarter of 2011 and third quarter of 2010.
Income taxes increased by $41 million in 2011 mainly due to
higher pre-tax income, partly offset by a lower blended statutory
income tax rate.
.Net income increased by $163 million or over 15% in 2011 when
compared to 2010. Excluding items shown in the following table,
Net income increased by approximately $112 million or 10% in 2011.
Analysis of Net income
Years ended December 31 ($ millions) 2 0 11 2010 Change
Net income 1,215 1,052 163
Deduct after-tax Transactel gain (12) – (12)
Add back third quarter 2010 after-tax
loss on redemption of debt – 37 (37)
Add back third quarter 2010 after-tax
regulatory financing charge – 11 (11)
Deduct net favourable income
tax-related adjustments,
including any related interest
income (see Section 5.2) (21) (30) 9
Net income before above
items (approximate) 1,182 1,070 112