Telus 2011 Annual Report Download - page 18
Download and view the complete annual report
Please find page 18 of the 2011 Telus annual report below. You can navigate through the pages in the report by either clicking on the pages listed below, or by using the keyword search tool below to find specific information within the annual report.-
 1
1 -
2
-
3
-
4
-
5
-
6
-
7
-
 8
8 -
 9
9 -
 10
10 -
 11
11 -
 12
12 -
 13
13 -
 14
14 -
 15
15 -
 16
16 -
 17
17 -
 18
18 -
 19
19 -
 20
20 -
 21
21 -
 22
22 -
 23
23 -
 24
24 -
 25
25 -
 26
26 -
 27
27 -
 28
28 -
29
-
30
-
31
-
32
-
33
-
34
-
35
-
36
-
37
-
38
-
39
-
40
-
41
-
42
-
43
-
44
-
45
-
46
-
47
-
48
-
49
-
50
-
51
-
52
-
53
-
54
-
55
-
56
-
57
-
58
-
59
-
60
-
61
-
62
-
63
-
64
-
65
-
66
-
67
-
68
-
69
-
70
-
71
-
72
-
73
-
74
-
75
-
76
-
77
-
78
-
79
-
80
-
81
-
82
-
83
-
84
-
85
-
86
-
87
-
88
-
89
-
90
-
91
-
92
-
93
-
94
-
95
-
96
-
97
-
98
-
99
-
100
-
101
-
102
-
103
-
104
-
105
-
106
-
107
-
108
-
109
-
110
-
111
-
112
-
113
-
114
-
115
-
116
-
117
-
118
-
119
-
120
-
121
-
122
-
123
-
124
-
125
-
126
-
127
-
128
-
129
-
130
-
131
-
132
-
133
-
134
-
135
-
136
-
137
-
138
-
139
-
140
-
141
-
142
-
143
-
144
-
145
-
146
-
147
-
148
-
149
-
150
-
151
-
152
-
153
-
154
-
155
-
156
-
157
-
158
-
159
-
160
-
161
-
162
-
163
-
164
-
165
-
166
-
167
-
168
-
169
-
170
-
171
-
172
-
173
-
174
-
175
-
176
-
177
-
178
-
179
-
180
-
181
-
182
 |
 |
14 . TELUS 2011 ANNUAL REPORT
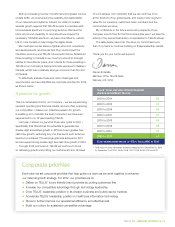
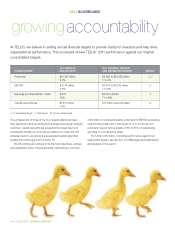
At TELUS, we believe in setting annual financial targets to provide clarity for investors and help drive
organizational performance. This scorecard shows TELUS’ 2011 performance against our original
consolidated targets.
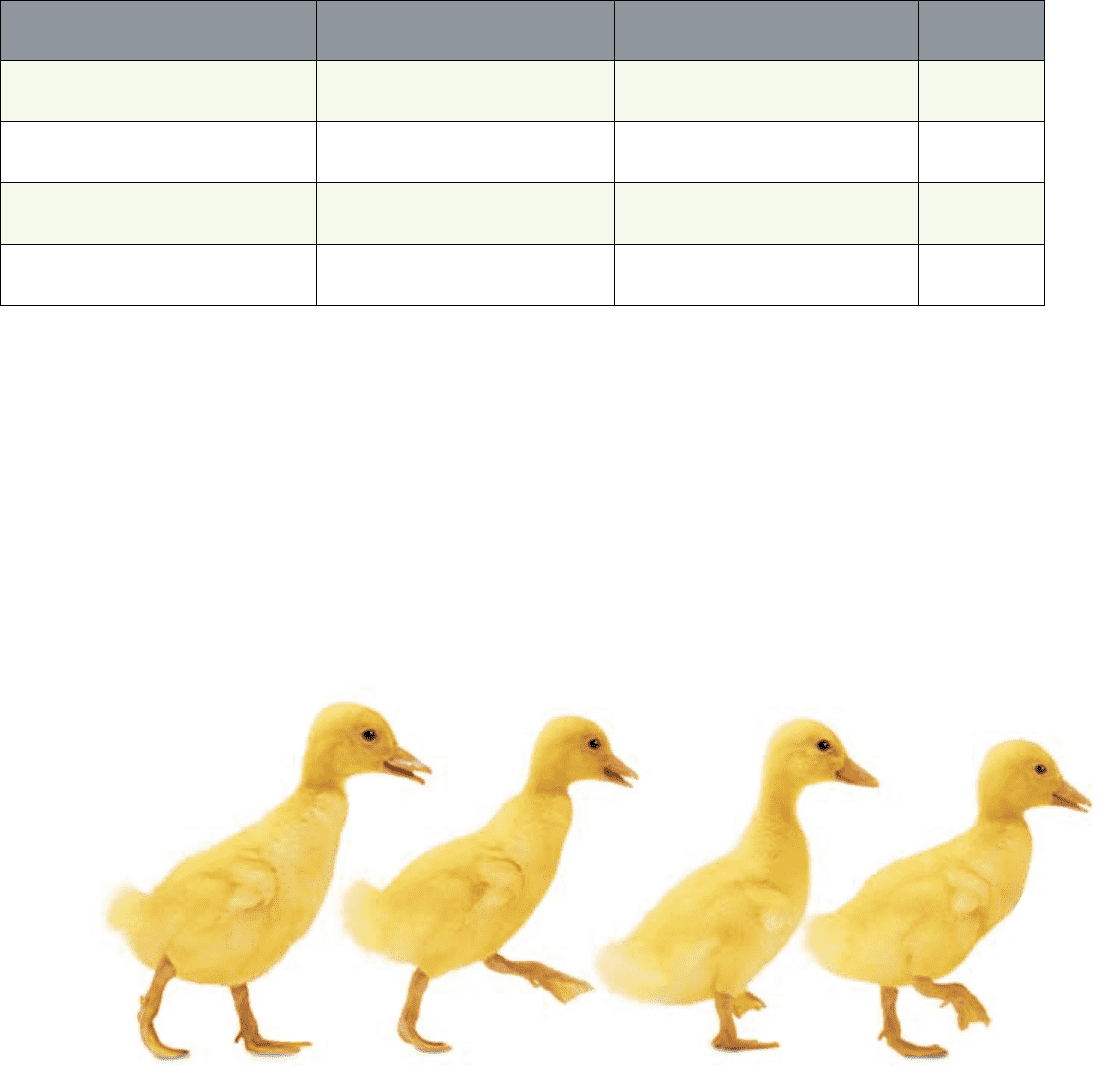
2011 SCORECARD
CONSOLIDATED
2011 RESULTS
AND GROWTH
2011 ORIGINAL TARGETS
AND ESTIMATED GROWTH
RESULT
Revenues $10.397 billion
6.2%
$9.925 to $10.225 billion
1 to 4%
44
EBITDA $3.778 billion
3.5%
$3.675 to $3.875 billion
1 to 6%
4
Earnings per share (EPS) – basic $3.76
15%
$3.50 to $3.90
7 to 19%
4
Capital expenditures $1.847 billion
7.3%
$1.7 billion approximately 6
44 Exceeded target 4 Met target 6 Did not meet target
growingaccountability
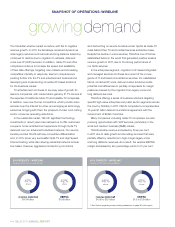
The achievement of three of the four targets reflects stronger
than expected customer loading and average revenue per wireless
customer. Capital expenditures exceeded the target due to an
accelerated timeline to commence building our urban 4G LTE
wireless network, as well as success-based capital spending
resulting from strong growth of Optik TV.
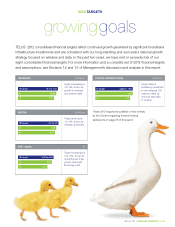
TELUS continues to adhere to its financial objectives, policies
and guidelines, which include generally maintaining a minimum
of $1 billion of unutilized liquidity, a Net debt to EBITDA (excluding
restructuring costs) ratio in the range of 1.5 to 2.0 times, and
a dividend
payout ratio guideline of 55 to 65% of sustainable
earnings on a prospective basis.
For further information, including performance against our
segmented targets, see Section 1.4 of Management’s discussion
and analysis in this report.