Telus 2011 Annual Report Download - page 44
Download and view the complete annual report
Please find page 44 of the 2011 Telus annual report below. You can navigate through the pages in the report by either clicking on the pages listed below, or by using the keyword search tool below to find specific information within the annual report.-
 1
1 -
2
-
3
-
4
-
5
-
6
-
7
-
8
-
9
-
10
-
11
-
12
-
13
-
14
-
15
-
16
-
17
-
18
-
19
-
20
-
21
-
22
-
23
-
24
-
25
-
26
-
27
-
28
-
29
-
30
-
31
-
32
-
33
-
 34
34 -
 35
35 -
 36
36 -
 37
37 -
 38
38 -
 39
39 -
 40
40 -
 41
41 -
 42
42 -
 43
43 -
 44
44 -
 45
45 -
 46
46 -
 47
47 -
 48
48 -
 49
49 -
 50
50 -
 51
51 -
 52
52 -
 53
53 -
 54
54 -
55
-
56
-
57
-
58
-
59
-
60
-
61
-
62
-
63
-
64
-
65
-
66
-
67
-
68
-
69
-
70
-
71
-
72
-
73
-
74
-
75
-
76
-
77
-
78
-
79
-
80
-
81
-
82
-
83
-
84
-
85
-
86
-
87
-
88
-
89
-
90
-
91
-
92
-
93
-
94
-
95
-
96
-
97
-
98
-
99
-
100
-
101
-
102
-
103
-
104
-
105
-
106
-
107
-
108
-
109
-
110
-
111
-
112
-
113
-
114
-
115
-
116
-
117
-
118
-
119
-
120
-
121
-
122
-
123
-
124
-
125
-
126
-
127
-
128
-
129
-
130
-
131
-
132
-
133
-
134
-
135
-
136
-
137
-
138
-
139
-
140
-
141
-
142
-
143
-
144
-
145
-
146
-
147
-
148
-
149
-
150
-
151
-
152
-
153
-
154
-
155
-
156
-
157
-
158
-
159
-
160
-
161
-
162
-
163
-
164
-
165
-
166
-
167
-
168
-
169
-
170
-
171
-
172
-
173
-
174
-
175
-
176
-
177
-
178
-
179
-
180
-
181
-
182
 |
 |

40 . TELUS 2011 ANNUAL REPORT
The discussion in this section is qualified in its entirety by the Caution
regarding forward-looking statements at the beginning of the MD&A.
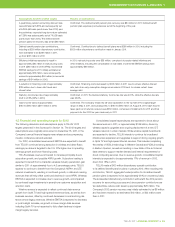
1.1 Preparation of the MD&A
The Company’s disclosure controls and procedures are designed to
provide reasonable assurance that all relevant information is gathered
and reported to senior management on a timely basis, so that appro-
priate decisions can be made regarding public disclosure. Management
determines whether or not information is material based on whether it
believes a reasonable investor’s decision to buy, sell or hold securities
in the Company would likely be influenced or changed if the information
were omitted or misstated. The MD&A and the Audited consolidated
financial statements were reviewed by TELUS’ Audit Committee and
approved by TELUS’ Board of Directors.
Management has issued guidance on and reports on certain
non-GAAP measures to evaluate performance of the Company and
its segments. Non-GAAP measures are also used to determine
compliance with debt covenants and to manage the capital structure.
Because non-GAAP measures do not generally have a standardized
meaning, securities regulations require such measures to be clearly
defined, qualified and reconciled with their nearest GAAP measure
(see Section 11). The term EBITDA (earnings before interest, taxes,
depreciation and amortization) used in this document means standard-
ized EBITDA as defined by the Canadian Performance Reporting Board
of the Canadian Institute of Chartered Accountants (CICA). Adjusted
EBITDA used in this document deducts from standardized EBITDA
items of an unusual nature that do not reflect ongoing telecommunica-
tions operations. See Section 11.1 for the definition, calculation and
reconciliation of EBITDA.
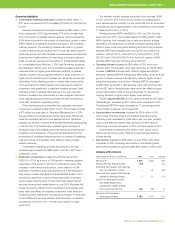
1.2 Canadian economy and telecommunications industry
Economic environment
The Bank of Canada maintained its target for the overnight borrowing
rate at 1% in its January 2012 bank rate announcement. The Bank’s
January 2012 Monetary Policy Report estimated economic growth of
2.4% for Canada in 2011. It also projected growth of 2.0% in 2012 and
2.8% in 2013, with the economy returning to full capacity by the third
quarter of 2013.
Statistics Canada’s Labour Force Survey reported the December 2011
national unemployment rate had increased to 7.5% from 7.1% in Sep-
tember 2011, but was down slightly from 7.6% in December 2010 (see
Section 10.11 Economic growth and fluctuations). In January 2012,
the national unemployment rate edged up to 7.6%.
Telecommunications industry
The Company estimates that growth in Canadian telecommunications
industry revenue (including TV revenue and excluding media revenue;
see Competition overview in Section 4.1) was approximately 3% in 2011,
driven by continued growth in the wireless sector.
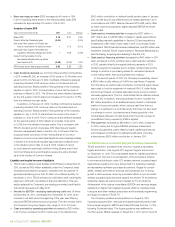
Canadian wireless industry revenue and EBITDA growth for 2011
are estimated at approximately 4.5% and 2%, respectively. Increased
competitive intensity from established national competitors and new
entrants, as well as new smartphones and tablets, attracted more
than 1.6 million new industry subscribers in 2011, or an approximate
4.3 percentage point increase in penetration to just over 77% of
the population. The wireless penetration rate in Canada is expected
to increase further in 2012 by between 4.0 and 4.5 percentage points.
The Canadian wireline sector is expected to continue to face
pressure on legacy voice services from strong competitive intensity
and technological substitution to growing data and wireless services.
Growth opportunities remain in wireline data, including Internet,
and IP-based TV and entertainment services.
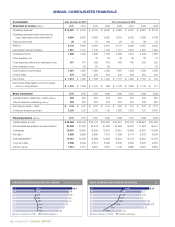
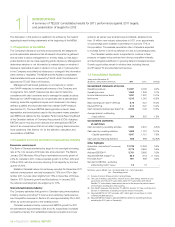
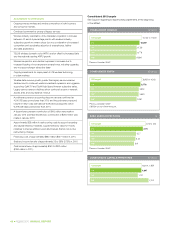
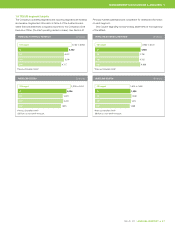
1.3 Consolidated highlights
Years ended December 31
($ millions, unless noted otherwise) 2 0 11 2010 Change
Consolidated statements of income
Operating revenues 10,397 9,792 6.2%
Operating income 1,968 1,909 3.1%
Income before income taxes 1,591 1,387 14.7%
Net income 1,215 1,052 15.5%
Basic earnings per share(1) (EPS) ($) 3.76 3.27 15.0%
Diluted EPS(1) ($) 3.74 3.27 14.4%
Cash dividends declared per share(1) ($) 2.205 2.00 10.3%
Average shares(1) outstanding
– basic (millions) 324 320 1.3%
Consolidated statements
of cash flows
Cash provided by operating activities 2,550 2,670 (4.5)%
Cash used by investing activities 1,968 1,731 13.7%
– Capital expenditures 1,847 1,721 7.3%
Cash used by financing activities 553 963 (42.6)%
Other highlights
Subscriber connections(2) (thousands) 12,728 12,253 3.9%
EBITDA(3) 3,778 3,650 3.5%
Adjusted EBITDA(3)(4) 3,761 3,650 3.0%
Adjusted EBITDA margin(5) (%) 36.2 37.3 (1.1) pts.
Free cash flow(3) 997 939 6.2%
Net debt to EBITDA – excluding
restructuring costs(3) (times) 1.8 1.8 –
Notations used in MD&A: n/a – Not applicable; n/m – Not meaningful;
pts. – Percentage points.
(1) Includes Common Shares and Non-Voting Shares.
(2) The sum of wireless subscribers, network access lines (NALs), Internet access
subscribers and TELUS TV subscribers (Optik TVTM subscribers and TELUS
Satellite TV® subscribers), measured at the end of the respective periods based
on information in billing and other systems.
(3) Non-GAAP measures. See Section 11.1 EBITDA, Section 11.2 Free cash flow and
Section 11.4 Definitions of liquidity and capital resource measures.
(4) Adjusted EBITDA for 2011 excludes a $17 million gain on purchase of control
of Transactel (Barbados) Inc.
(5) Adjusted EBITDA margin is adjusted EBITDA divided by (Operating revenues
excluding the 2011 gain on Transactel).
1INTRODUCTION
A summary of TELUS’ consolidated results for 2011, performance against 2011 targets,
and presentation of targets for 2012