Telus 2011 Annual Report Download - page 149
Download and view the complete annual report
Please find page 149 of the 2011 Telus annual report below. You can navigate through the pages in the report by either clicking on the pages listed below, or by using the keyword search tool below to find specific information within the annual report.-
 1
1 -
2
-
3
-
4
-
5
-
6
-
7
-
8
-
9
-
10
-
11
-
12
-
13
-
14
-
15
-
16
-
17
-
18
-
19
-
20
-
21
-
22
-
23
-
24
-
25
-
26
-
27
-
28
-
29
-
30
-
31
-
32
-
33
-
34
-
35
-
36
-
37
-
38
-
39
-
40
-
41
-
42
-
43
-
44
-
45
-
46
-
47
-
48
-
49
-
50
-
51
-
52
-
53
-
54
-
55
-
56
-
57
-
58
-
59
-
60
-
61
-
62
-
63
-
64
-
65
-
66
-
67
-
68
-
69
-
70
-
71
-
72
-
73
-
74
-
75
-
76
-
77
-
78
-
79
-
80
-
81
-
82
-
83
-
84
-
85
-
86
-
87
-
88
-
89
-
90
-
91
-
92
-
93
-
94
-
95
-
96
-
97
-
98
-
99
-
100
-
101
-
102
-
103
-
104
-
105
-
106
-
107
-
108
-
109
-
110
-
111
-
112
-
113
-
114
-
115
-
116
-
117
-
118
-
119
-
120
-
121
-
122
-
123
-
124
-
125
-
126
-
127
-
128
-
129
-
130
-
131
-
132
-
133
-
134
-
135
-
136
-
137
-
138
-
 139
139 -
 140
140 -
 141
141 -
 142
142 -
 143
143 -
 144
144 -
 145
145 -
 146
146 -
 147
147 -
 148
148 -
 149
149 -
 150
150 -
 151
151 -
 152
152 -
 153
153 -
 154
154 -
 155
155 -
 156
156 -
 157
157 -
 158
158 -
 159
159 -
160
-
161
-
162
-
163
-
164
-
165
-
166
-
167
-
168
-
169
-
170
-
171
-
172
-
173
-
174
-
175
-
176
-
177
-
178
-
179
-
180
-
181
-
182
 |
 |

TELUS 2011 ANNUAL REPORT . 145
FINANCIAL STATEMENTS & NOTES: 15
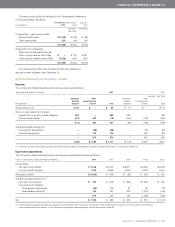
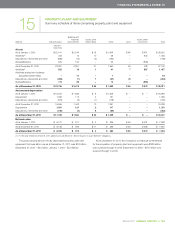
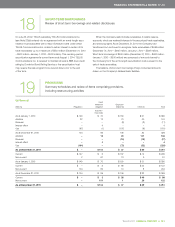
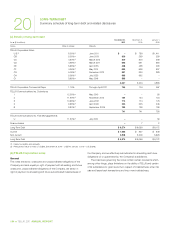
15 PROPERTY, PLANT AND EQUIPMENT
Summary schedule of items comprising property, plant and equipment
Buildings and
leasehold Assets under Assets under
(millions) Network assets improvements finance lease Other Land construction Total
(adjusted –
Note 25(d))
At cost
As at January 1, 2010 $ß22,141 $ß2,244 $ß13 $ß1,644 $ß49 $ß431 $ß26,522
Additions(1) 443 15 10 35 – 840 1,343
Dispositions, retirements and other (568) (13) (2) (182) – – (765)
Reclassifications 675 105 – 53 – (833) –
As at December 31, 2010 22,691 2,351 21 1,550 49 438 27,100
Additions(1) 502 19 1 41 7 887 1,457
Additions arising from business
acquisitions (Note 16(e)) – 11 – 7 – – 18
Dispositions, retirements and other (206) (7) 1 (51) (1) – (264)
Reclassifications 779 99 – 75 – (953) –
As at December 31, 2011 $ß23,766 $ß2,473 $ß23 $ß1,622 $ß55 $ß372 $ß28,311
Accumulated depreciation
As at January 1, 2010 $ß16,040 $ß1,333 $ß 9 $ß1,308 $ß – $ß – $ß18,690
Depreciation 1,088 118 2 131 – – 1,339
Dispositions, retirements and other (573) (8) (1) (178) – – (760)
As at December 31, 2010 16,555 1,443 10 1,261 – – 19,269
Depreciation 1,091 121 2 117 – – 1,331
Dispositions, retirements and other (218) (4) 8 (39) – – (253)
As at December 31, 2011 $ß17,428 $ß1,560 $ß20 $ß1,339 $ß – $ß – $ß20,347
Net book value
As at January 1, 2010 $ß 6,101 $ 911 $ß 4 $ 336 $ß49 $ß431 $ß 7,832
As at December 31, 2010 $ß 6,136 $ 908 $ß11 $ 289 $ß49 $ß438 $ß 7,831
As at December 31, 2011 $ß 6,338 $ 913 $ß 3 $ 283 $ß55 $ß372 $ß 7,964
(1) For the year ended December 31, 2011, additions include $15 (2010 – $12) in respect of asset retirement obligations.
The gross carrying amount of fully depreciated property, plant and
equipment that was still in use as at December 31, 2011, was $3.0 billion
(December 31, 2010 – $3.0 billion; January 1, 2010 – $2.6 billion).
As at December 31, 2011, the Company’s contractual commitments
for the acquisition of property, plant and equipment were $188 million
over a period through to 2013 (December 31, 2010 – $170 million over
a period through to 2013).