Telus 2011 Annual Report Download - page 67
Download and view the complete annual report
Please find page 67 of the 2011 Telus annual report below. You can navigate through the pages in the report by either clicking on the pages listed below, or by using the keyword search tool below to find specific information within the annual report.-
 1
1 -
2
-
3
-
4
-
5
-
6
-
7
-
8
-
9
-
10
-
11
-
12
-
13
-
14
-
15
-
16
-
17
-
18
-
19
-
20
-
21
-
22
-
23
-
24
-
25
-
26
-
27
-
28
-
29
-
30
-
31
-
32
-
33
-
34
-
35
-
36
-
37
-
38
-
39
-
40
-
41
-
42
-
43
-
44
-
45
-
46
-
47
-
48
-
49
-
50
-
51
-
52
-
53
-
54
-
55
-
56
-
 57
57 -
 58
58 -
 59
59 -
 60
60 -
 61
61 -
 62
62 -
 63
63 -
 64
64 -
 65
65 -
 66
66 -
 67
67 -
 68
68 -
 69
69 -
 70
70 -
 71
71 -
 72
72 -
 73
73 -
 74
74 -
 75
75 -
 76
76 -
 77
77 -
78
-
79
-
80
-
81
-
82
-
83
-
84
-
85
-
86
-
87
-
88
-
89
-
90
-
91
-
92
-
93
-
94
-
95
-
96
-
97
-
98
-
99
-
100
-
101
-
102
-
103
-
104
-
105
-
106
-
107
-
108
-
109
-
110
-
111
-
112
-
113
-
114
-
115
-
116
-
117
-
118
-
119
-
120
-
121
-
122
-
123
-
124
-
125
-
126
-
127
-
128
-
129
-
130
-
131
-
132
-
133
-
134
-
135
-
136
-
137
-
138
-
139
-
140
-
141
-
142
-
143
-
144
-
145
-
146
-
147
-
148
-
149
-
150
-
151
-
152
-
153
-
154
-
155
-
156
-
157
-
158
-
159
-
160
-
161
-
162
-
163
-
164
-
165
-
166
-
167
-
168
-
169
-
170
-
171
-
172
-
173
-
174
-
175
-
176
-
177
-
178
-
179
-
180
-
181
-
182
 |
 |

TELUS 2011 ANNUAL REPORT . 63
MANAGEMENT’S DISCUSSION & ANALYSIS: 5
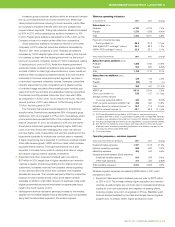
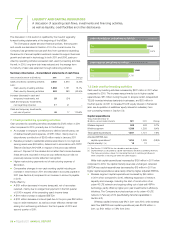
Increased gross subscriber additions reflect an enhanced handset
line-up, promotional activity and continued efforts to attract high-
value postpaid customers including to Koodo services, partly offset
by increased competitive intensity within both the postpaid and
prepaid market segments. Total gross subscriber additions increased
by 5.1% in 2011, while postpaid gross additions increased by 11%
in 2011. Prepaid gross additions decreased by 6.9% in 2011, as the
Company chose not to match certain offers from competitors.
Gross subscriber additions increased by 88,000 in 2011 when
com pared to 2010, while net subscriber additions decreased by
78,000 in 2011 when compared to 2010. Postpaid net additions
increased by 10,000 despite higher churn rates resulting from the loss
of a wire less contract with the federal government to a low-priced
bid by an incumbent competitor (a loss of 77,000 subscribers, adding
11 basis points to churn in 2011). Aside from federal government
sub scriber losses, post paid net additions were strong and reflect the
success of efforts to retain high-value subscribers. Lower overall net
additions reflect increased competitive intensity from new entrants,
particularly in the lower-value and prepaid segments, and new or
re-launched incum bent competitor brands. Increased competitive
intensity was evident in price competition and a greater number
of unlimited-usage rate plans offers entailing higher handset sub
-
sidies from both new entrants and established national competitors.
The blended monthly wireless subscriber churn rate was 1.68%,
as compared to 1.57% in 2010. Churn rates for the fourth, third and
second quarters of 2011 were stable at 1.67% following a rate of
1.70% in the first quarter of 2011.
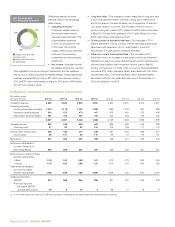
The Company has experienced acceleration in smartphone
adoption rates. Smartphones represented 66% of postpaid gross
additions in 2011, as compared to 37% in 2010. Cumulatively, smart-
phone subscribers represented 53% of the postpaid subscriber
base at December 31, 2011, as compared to 33% one year earlier.
Smartphone subscribers generate significantly higher ARPU and
lower churn than those with messaging and voice-only devices,
but have higher costs of acquisition and retention resulting from the
large device subsidies for multiple-year contract sales or renewals.
A higher smartphone mix is expected to continue to positively impact
future data revenue growth, ARPU and churn rates, which increase
expected lifetime revenue. The higher smartphone mix is also
expected to increase future costs of retention and network usage,
and require ongoing network capacity investments.
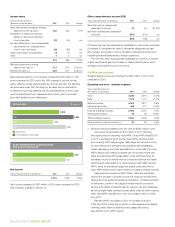
.Equipment and other revenues increased year over year by
$57 mil lion in 2011, largely due to higher acquisition and retention
volumes, a greater smartphone loading mix for retained and new
subscribers, increased revenues from postpaid clients upgrading
to new devices before the end of their contracts, and increased
accessories revenues. The increase was partly offset by competitive
pressure to lower handset prices, which drove higher handset
sub sidies. In addition, a $3 million recovery of employee costs under
eligible government-sponsored employment programs was recog-
nized in the fourth quarter of 2011.
.Intersegment revenue represents services provided by the wireless
segment to the wireline segment and is eliminated upon consolidation
along with the associated expense in the wireline segment.
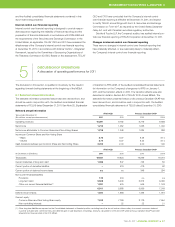
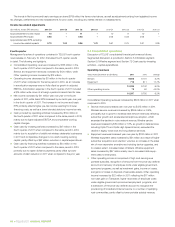
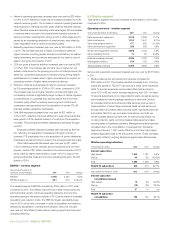
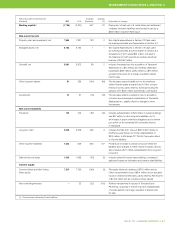
Wireless operating indicators
At December 31 2 0 11 2010 Change
Subscribers (000s)
Postpaid 6,130 5,705 7.4%
Prepaid 1,210 1,266 (4.4)%
Total 7,340 6,971 5.3%
Proportion of subscriber base
that is postpaid (%) 83.5 81.8 1.7 pts.
Total digital POP(1) coverage(2) (millions) 34.4 33.8 1.8%
HSPA+ POP coverage(2) (millions) 33.8 33.1 2.1%
Years ended December 31 2 0 11 2010 Change
Subscriber gross additions (000s)
Postpaid 1,286 1,160 10.9%
Prepaid 512 550 (6.9)%
Total 1,798 1,710 5.1%
Subscriber net additions (000s)
Postpaid 425 415 2.4%
Prepaid (56) 32 n/m
Total 369 447 (17.4)%
ARPU(3) ($) 59.10 57.64 2.5%
Churn, per month(3) (%) 1.68 1.57 0.11 pts.
Average monthly minutes
of use per subscriber (MOU) 332 361 (8.0)%
COA(4) per gross subscriber addition(3) ($) 386 350 10.3%
Retention spend to network revenue(3) (%) 12.4 11.6 0.8 pts.
EBITDA to network revenue (%) 43.7 43.8 (0.1) pts.
(1) POP is an abbreviation for population. A POP refers to one person living in a
population area that is wholly or substantially included in the coverage area. Canada’s
population was estimated at 34.6 million in October 2011 (Statistics Canada website).
(2)
Including roaming/resale and network access agreements, principally with Bell Canada.
(3) See Section 11.3 Definitions of key wireless operating indicators. These are industry
measures useful in assessing operating performance of a wireless company, but are
not measures defined under IFRS-IASB.
(4) Cost of acquisition.
Operating expenses – wireless segment
Years ended December 31 ($ millions) 2 0 11 2010 Change
Equipment sales expenses 1,237 1,015 21.9%
Network operating expenses 662 640 3.4%
Marketing expenses 464 440 5.5%
General and administration (G&A) expenses
Employee benefits expense 540 508 6.3%
Other G&A expenses 411 422 (2.6)%
Total operating expenses 3,314 3,025 9.6%
Wireless segment expenses increased by $289 million in 2011 when
compared to 2010.
.Equipment sales expenses increased year over year by $222 million
or 22% in 2011. The increase reflects higher acquisition and retention
volumes, as well as higher per-unit costs due to increased smartphone
loading for both new subscribers and migration of existing clients,
including a higher proportion of upgrades to iPhone, BlackBerry and
Android devices facilitated by the Clear and Simple Device Upgrade
program and, to a lesser extent, higher accessories costs.