Telus 2011 Annual Report Download - page 137
Download and view the complete annual report
Please find page 137 of the 2011 Telus annual report below. You can navigate through the pages in the report by either clicking on the pages listed below, or by using the keyword search tool below to find specific information within the annual report.-
 1
1 -
2
-
3
-
4
-
5
-
6
-
7
-
8
-
9
-
10
-
11
-
12
-
13
-
14
-
15
-
16
-
17
-
18
-
19
-
20
-
21
-
22
-
23
-
24
-
25
-
26
-
27
-
28
-
29
-
30
-
31
-
32
-
33
-
34
-
35
-
36
-
37
-
38
-
39
-
40
-
41
-
42
-
43
-
44
-
45
-
46
-
47
-
48
-
49
-
50
-
51
-
52
-
53
-
54
-
55
-
56
-
57
-
58
-
59
-
60
-
61
-
62
-
63
-
64
-
65
-
66
-
67
-
68
-
69
-
70
-
71
-
72
-
73
-
74
-
75
-
76
-
77
-
78
-
79
-
80
-
81
-
82
-
83
-
84
-
85
-
86
-
87
-
88
-
89
-
90
-
91
-
92
-
93
-
94
-
95
-
96
-
97
-
98
-
99
-
100
-
101
-
102
-
103
-
104
-
105
-
106
-
107
-
108
-
109
-
110
-
111
-
112
-
113
-
114
-
115
-
116
-
117
-
118
-
119
-
120
-
121
-
122
-
123
-
124
-
125
-
126
-
 127
127 -
 128
128 -
 129
129 -
 130
130 -
 131
131 -
 132
132 -
 133
133 -
 134
134 -
 135
135 -
 136
136 -
 137
137 -
 138
138 -
 139
139 -
 140
140 -
 141
141 -
 142
142 -
 143
143 -
 144
144 -
 145
145 -
 146
146 -
 147
147 -
148
-
149
-
150
-
151
-
152
-
153
-
154
-
155
-
156
-
157
-
158
-
159
-
160
-
161
-
162
-
163
-
164
-
165
-
166
-
167
-
168
-
169
-
170
-
171
-
172
-
173
-
174
-
175
-
176
-
177
-
178
-
179
-
180
-
181
-
182
 |
 |

TELUS 2011 ANNUAL REPORT . 133
FINANCIAL STATEMENTS & NOTES: 10–11
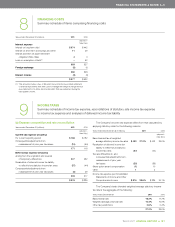
As at December 31, 2011, the Company’s estimate of the net amount
of existing gains (losses) arising from the unrealized fair value of deriva-
tives designated as cash flow hedges which are reported in accumulated
other comprehensive income and are expected to be reclassified to net
income in the next twelve months, excluding tax effects, is $3 million.
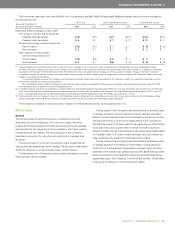
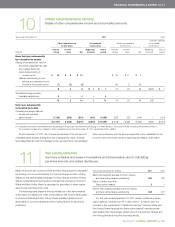
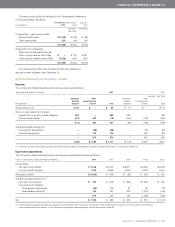
10 OTHER COMPREHENSIVE INCOME
Details of other comprehensive income and accumulated amounts
Years ended December 31 2 0 11 2010
(adjusted – Note 25)
Other comprehensive Accumulated Other comprehensive Accumulated
income (loss) income (loss) income (loss) income (loss)
Amount Income Beginning End of Amount Income Beginning End of
(millions) arising taxes Net of period period arising taxes Net of period period
Items that may subsequently
be reclassified to income
Change in unrealized fair value of
derivatives designated as cash
flow hedges (Note 4(i))
Gains (losses) arising in
current period $ß 15 $ 5 $ 10 $ 15 $ 11 $ 4
(Gains) losses arising in prior
periods and transferred to net
income in the current period (7) (3) (4) 59 9 50
8 2 6 $ 1 $ß 7 74 20 54 $ß(53) $ 1
Cumulative foreign currency
translation adjustment 4 – 4 – 4 – – – – –
12 2 10 1 11 74 20 54 (53) 1
Item never subsequently
reclassified to income
Cumulative employee defined
benefit plan actuarial
gains (losses)(1) (1,139) (288) (851) (214) (1,065) (287) (73) (214) – (214)
$ß(1,127) $ß(286) $ß(841) $ß(213) $ß(1,054) $ß(213) $ß(53) $ß(160) $ß(53) $ß(213)
(1) Cumulative employee defined benefit plan actuarial gains (losses) are only those amounts arising on or after January 1, 2010 (see Note 25); excluding the tax effects thereon,
the cumulative net gain (loss) charged to other comprehensive income at December 31, 2011, was $(1,426) (2010 – $(287)).
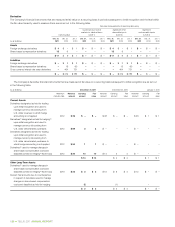
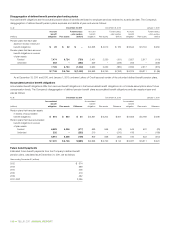
11 PER SHARE AMOUNTS
Summary schedule and review of numerators and denominators used in calculating
per share amounts and related disclosures
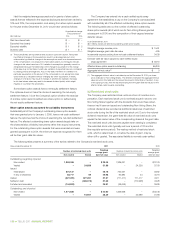
Basic net income per Common Share and Non-Voting Share is calculated
by dividing net income attributable to Common Shares and Non-Voting
Shares by the total weighted average Common Shares and Non-Voting
Shares outstanding during the period. Diluted net income per Common
Share and Non-Voting Share is calculated to give effect to share option
awards and restricted stock units.
The following table presents the reconciliations of the denominators
of the basic and diluted per share computations. Net income attributable
to Common Shares and Non-Voting Shares equalled diluted income
attributable to Common Shares and Non-Voting Shares for all periods
presented.
Years ended December 31 (millions) 2 0 11 2010
Basic total weighted average Common Shares
and Non-Voting Shares outstanding 324 320
Effect of dilutive securities
Share option awards 2 1
Diluted total weighted average Common Shares
and Non-Voting Shares outstanding 326 321
For the year ended December 31, 2011, certain outstanding share
option awards, in the amount of 1 million (2010 – 5 million), were not
included
in the computation of diluted income per Common Share and
Non-Voting
Share because the share option awards’ exercise prices
were greater than the average market price of the Common Shares and
Non-Voting Shares during the reported periods.