Telus 2011 Annual Report Download - page 65
Download and view the complete annual report
Please find page 65 of the 2011 Telus annual report below. You can navigate through the pages in the report by either clicking on the pages listed below, or by using the keyword search tool below to find specific information within the annual report.-
 1
1 -
2
-
3
-
4
-
5
-
6
-
7
-
8
-
9
-
10
-
11
-
12
-
13
-
14
-
15
-
16
-
17
-
18
-
19
-
20
-
21
-
22
-
23
-
24
-
25
-
26
-
27
-
28
-
29
-
30
-
31
-
32
-
33
-
34
-
35
-
36
-
37
-
38
-
39
-
40
-
41
-
42
-
43
-
44
-
45
-
46
-
47
-
48
-
49
-
50
-
51
-
52
-
53
-
54
-
 55
55 -
 56
56 -
 57
57 -
 58
58 -
 59
59 -
 60
60 -
 61
61 -
 62
62 -
 63
63 -
 64
64 -
 65
65 -
 66
66 -
 67
67 -
 68
68 -
 69
69 -
 70
70 -
 71
71 -
 72
72 -
 73
73 -
 74
74 -
 75
75 -
76
-
77
-
78
-
79
-
80
-
81
-
82
-
83
-
84
-
85
-
86
-
87
-
88
-
89
-
90
-
91
-
92
-
93
-
94
-
95
-
96
-
97
-
98
-
99
-
100
-
101
-
102
-
103
-
104
-
105
-
106
-
107
-
108
-
109
-
110
-
111
-
112
-
113
-
114
-
115
-
116
-
117
-
118
-
119
-
120
-
121
-
122
-
123
-
124
-
125
-
126
-
127
-
128
-
129
-
130
-
131
-
132
-
133
-
134
-
135
-
136
-
137
-
138
-
139
-
140
-
141
-
142
-
143
-
144
-
145
-
146
-
147
-
148
-
149
-
150
-
151
-
152
-
153
-
154
-
155
-
156
-
157
-
158
-
159
-
160
-
161
-
162
-
163
-
164
-
165
-
166
-
167
-
168
-
169
-
170
-
171
-
172
-
173
-
174
-
175
-
176
-
177
-
178
-
179
-
180
-
181
-
182
 |
 |

TELUS 2011 ANNUAL REPORT . 61
MANAGEMENT’S DISCUSSION & ANALYSIS: 5
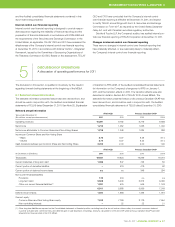
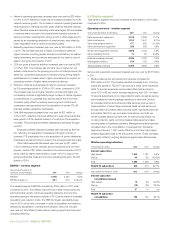
Operating expenses
Years ended December 31 ($ millions) 2 0 11 2010 Change
Goods and services purchased 4,726 4,236 11.6%
Employee benefits expense 1,893 1,906 (0.7)%
Depreciation 1,331 1,339 (0.6)%
Amortization of intangible assets 479 402 19.2%
8,429 7,883 6.9%
Consolidated operating expenses increased by $546 million in 2011 when
compared to 2010.
.Goods and services purchased increased year over year by $490 mil-
lion in 2011, reflecting higher wireless costs of acquisition and retention
and increased content and support costs for expanding and managing
wireline Optik TV services.
.Employee benefits expense decreased year over year by $13 million
in 2011. The decrease mainly reflects lower employee-related
restructuring costs, a higher defined benefit pension plan recovery,
lower share-based compensation expenses mainly due to employees
choosing to settle their options other than through a net-cash
settlement feature, and higher capitalization of labour, partly offset
by increased wage and salary expenses. Wage and salary expenses
increased by $85 million due to the following: inclusion of Transactel
operations since February 2011 and TELUS-branded wireless
dealership businesses acquired in 2011, hiring to support the growing
wireless and TV subscriber bases, bargaining unit wage increases
effective since July 2011, and management salary and compensation
increases effective April 2011.
.Depreciation expense decreased year over year by $8 million in 2011.
Lower depreciation expenses were largely due to an increase in
fully depreciated assets and lower depreciation for TV set-top boxes
caused by lengthening their expected service lives in the second
quarter of 2010, largely offset by growth in wireless HSPA+ and other
capital assets and acquired Transactel assets.
.Amortization of intangible assets increased year over year by
$77 million in 2011. The increase was principally due to ongoing
capital investments in network and administrative software assets,
a $19 million write-down of a foreign operation’s assets held for
sale at the end of 2011, amortization resulting from the acquisition
of Transactel and certain wireless dealership businesses in 2011,
and prior year recognition of $5 million of investment tax credits in
the second quarter of 2010.
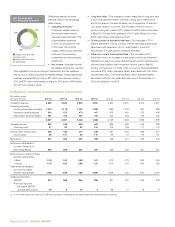
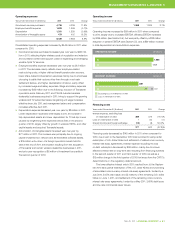
Operating income
Years ended December 31 ($ millions) 2 0 11 2010 Change
1,968 1,909 3.1%
Operating income increased by $59 million in 2011 when compared
to 2010, largely due to increased EBITDA. Wireless EBITDA increased
by $166 million (see Section 5.4), but was partly offset by a $38 million
reduction in wireline EBITDA (see Section 5.5), and a $69 million increase
in total depreciation and amortization expenses.
10
09
OPERATING INCOME ($ millions)
11 1,968
1, 909
10
10
09
08
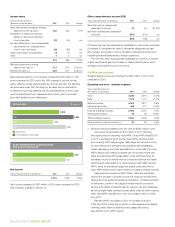
Excluding loss on redemption of debt
Loss on redemption of debt
INTEREST EXPENSE ($ millions)
11 389
527
52475
10
Financing costs
Years ended December 31 ($ millions) 2 0 11 2010 Change
Interest expense, excluding loss
on redemption of debt 389 475 (18.1)%
Loss on redemption of debt – 52 n/m
Interest income and foreign exchange (12) (5) 140.0%
377 522 (27.8)%
Financing costs decreased by $145 million in 2011 when compared to
2010, due in part to the September 2010 loss recorded for early partial
redemption of U.S. dollar Notes and settlement of related cross currency
interest rate swap agreements. Interest expense excluding the loss
on debt redemption decreased by $86 million, mainly due to a lower
effective interest rate on long-term debt resulting from financing activities
in the second quarter of 2011 and third quarter of 2010, as well as a
$15 million charge in the third quarter of 2010 that arose from the CRTC’s
determinations on the regulatory deferral account.
The lower effective interest rate in 2011 resulted from: (i) the Septem-
ber 2010 early partial redemption of 8% U.S. dollar Notes and unwinding
of associated cross currency interest rate swap agreements, funded by a
July 2010, 5.05% debt issue; and (ii) maturity of the remaining U.S. dollar
Notes on June 1, 2011, and settlement of the remaining cross currency
interest rate swap agreements, funded by a May 2011, 3.65% debt issue
and low-rate commercial paper issues.